Deschutes River

Ceratonova shasta monitoring studies in the Deschutes River Basin

Deschutes River

Ceratonova shasta monitoring studies in the Deschutes River Basin

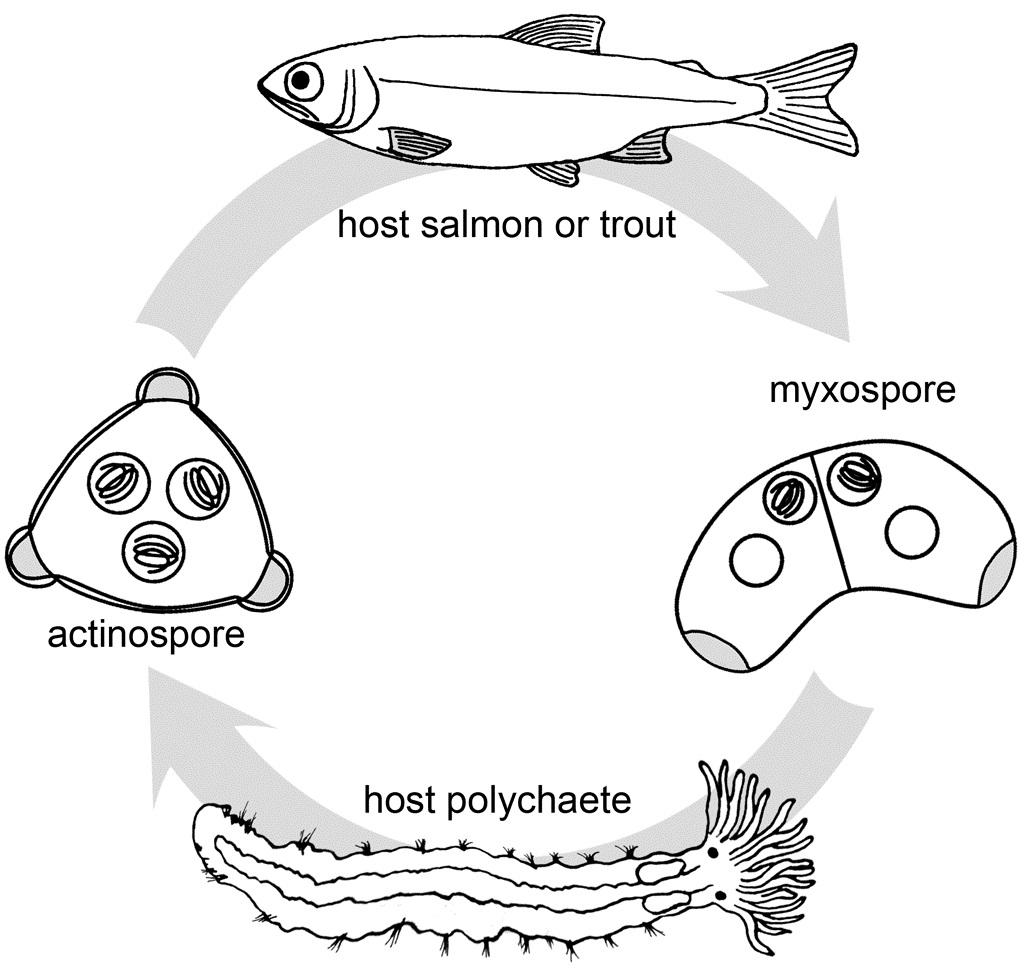
An illustrated lifecycle chart of myxospore pointing to host polychaete pointing to actinospore pointing to host salmon or trout in a circle.

Ceratonova shasta is a freshwater, myxozoan parasite that is native to the Pacific North West of North America. It causes enteronecrosis in salmonids which, in the Deschutes River Basin, has resulted in high mortality in cultured juvenile salmon at the Pelton Facility and in adult salmon returning to both the Round Butte and Warm Springs hatcheries. Transmission occurs through waterborne stages: actinospores released from polychaete worms infect salmonid fishes and develop into myxospores which then infect polychaetes (see life cycle on left). The parasite proliferates in each host (not in water).

“By understanding the relationships between the parasite, its hosts, and the natural habitats and conditions that are favorable or unfavorable for infection, strategies can be developed to limit the exposure of fish to areas where the risk of infection of C. shasta may be higher, or develop management strategies based upon predicted water and climate conditions to improve the survival and viability of wild and hatchery salmonids.” Cyndi Baker, PhD, CTWSRO.

Through collaboration with the Confederated Tribes of the Warm Springs Reservation of Oregon (CTWSRO), USFWS, and ODFW we have developed a parasite monitoring program which contributes to our understanding of the role of pathogens (such as Ceratonova shasta) in juvenile and pre-spawn mortalities of adult Spring Chinook salmon of the Deschutes River Basin. Monitoring is primarily through quantification of waterborne stages of the parasite.
A labeled map of the Deschutes River.

Deschutes River, a tributary of the Columbia River, in central Oregon. Study sites are shown as yellow diamonds. Red circles represent sites at which ISCO water sampling and sentinel fish exposures were conducted.

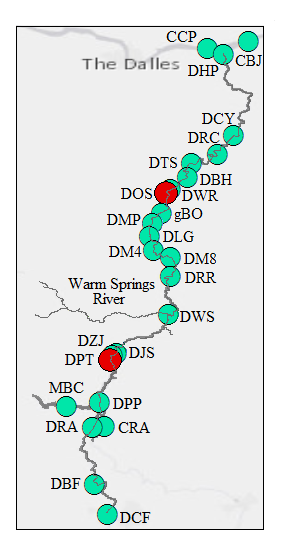
A map of the Deschutes River, highlighting the major tributaries, spatial, and temporal sampling sites in red and green.

Map of the Deschutes River basin including major tributaries as well as spatial (green and red) and temporal (red) water sampling sites.

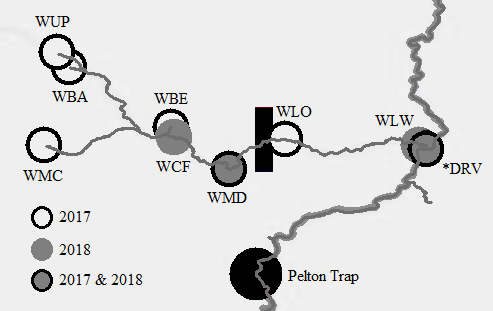
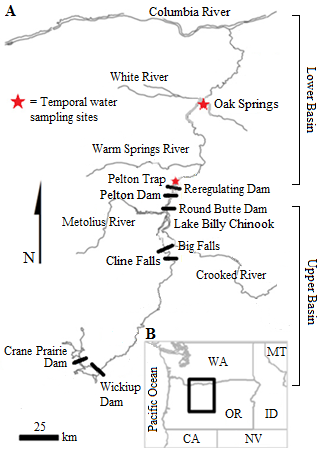
A map of the Warm Springs River and Deschutes River showing the temporal water sample collection sites.

Temporal water sample collection sites on the Warm Springs River and at the mouth of the Warm Springs River on the Deschutes River (DRV). Sites are represented by open circles (2017), dark grey circles (2018), and black circles filled with dark grey (2017 & 2018). The black bar represents the Warm Springs National Fish Hatchery, a migration barrier to salmonids. The Pelton Trap located below the Pelton Dam is included for reference. *Note the DRV site is on the Deschutes mainstem.

Water samples

We conduct two types of water sampling to provide high resolution data on the spatial and temporal abundance of Ceratonova shasta – regular monitoring as well as spatially intensive sporadic longitudinal sampling. Collection of river water samples for regular monitoring occurs at two index sites established in 2015; once a week all year round at Oak Springs and every other week from April through October at Pelton Dam (sites marked in red on map above). Beginning in 2017, monitoring will occur at a further 8 sites that span from the town of Bend to Heritage Landing at the mouth of the Deschutes River (see map above). Longitudinal sampling occurs approximately twice a year (in spring and summer) at 16-24 sites.

At the established index sites, solar-powered automatic samplers (ISCOs) collect 1L of water every 2 hours for 24 hours, from which 4 1L samples are manually taken, whereas samples are collected manually at the remaining index and longitudinal sites. Regardless of collection method, each 1L sample is filtered through a 5-micron nitrocellulose membrane using a vacuum pump, and any captured DNA in 3 of the replicate samples is extracted using a kit. A quantitative PCR (qPCR) specific for C. shasta is used to detect and quantify any parasite DNA present (Hallett & Bartholomew 2006). Cq values generated by the qPCR are converted to numbers of parasite spores per liter of water using reference samples with known quantities of spores. The Warm Springs tribal biologists and members of ODFW are integral to the collection and filtration of the ISCO water samples.

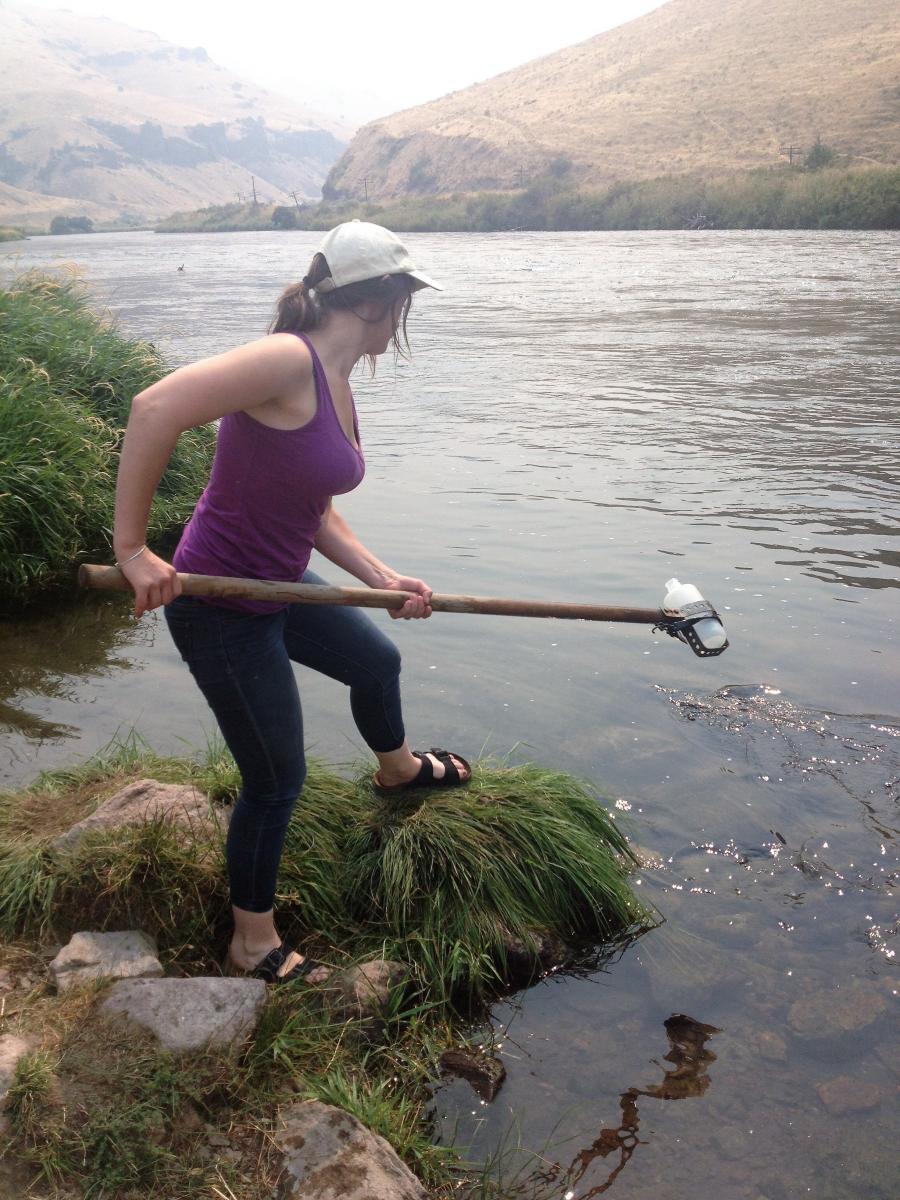
Microbiologist collecting water samples along a creek with a water bottle taped to a stick.

Collecting water samples on the Deschutes River.

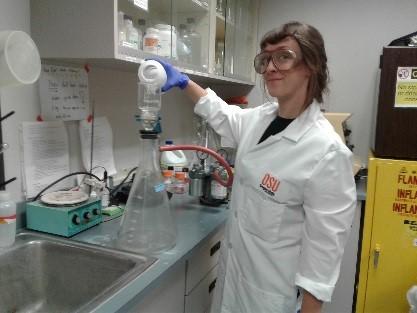
Microbiologist pouring water sample in vacuum pump.

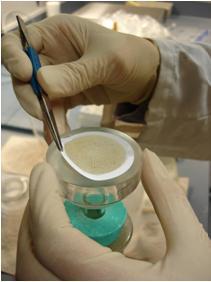
Filtering a water sample using a vacuum pump.

A pair of hands with gloves on removing a filter paper from lab equipment.

Folding the filter paper with captured material.

Temporal water sample monitoring at Oak Springs (first) and Pelton Trap (second)

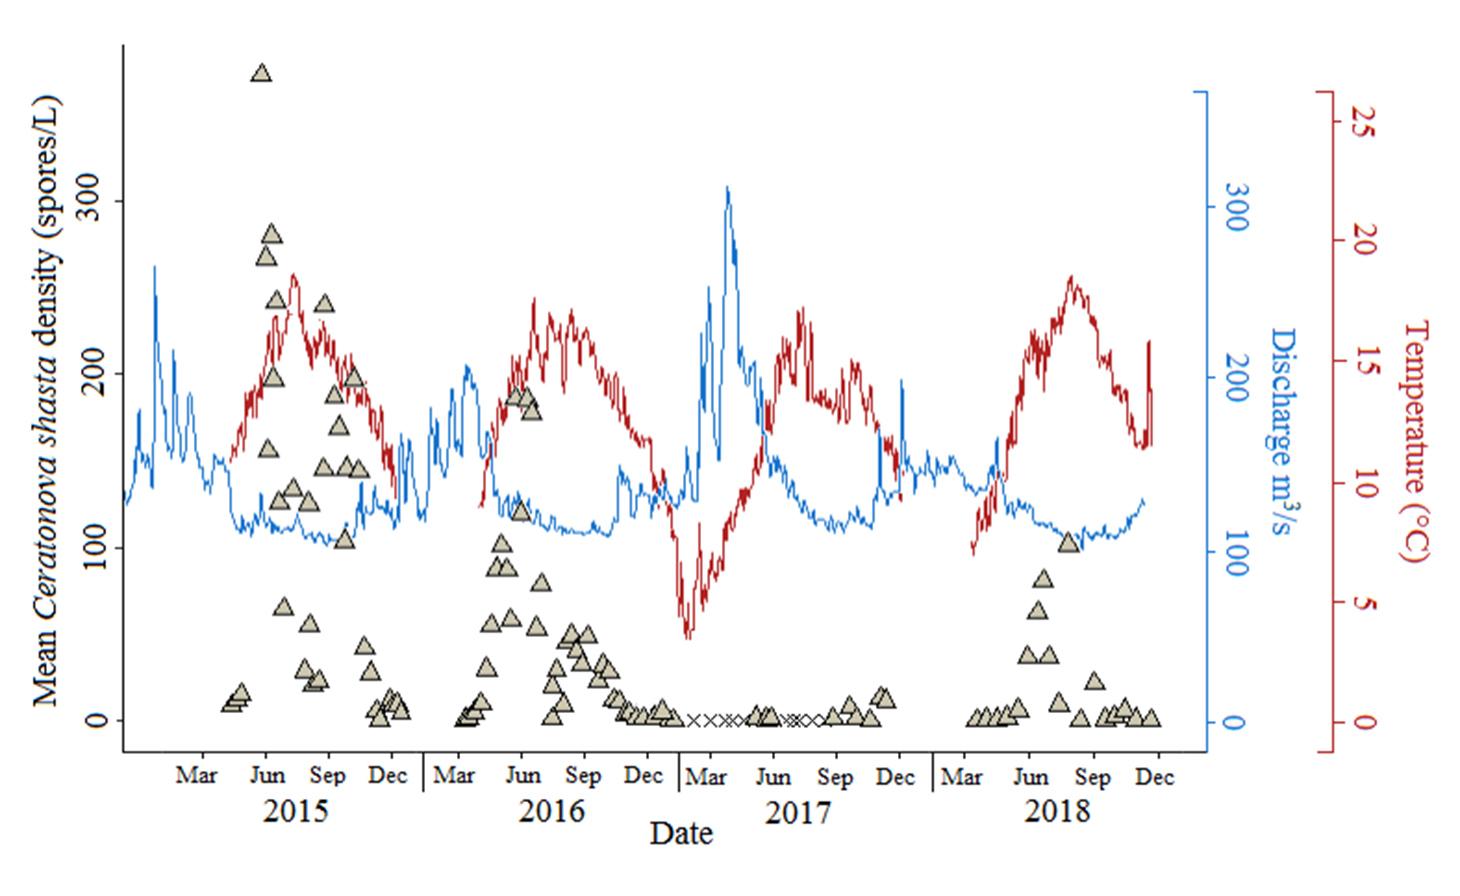
An image of a line chart comparing Mean Ceratonova shasta density (spore/L) with Discharges and Temperature at Oak Springs.

Mean Ceratonova shasta density (y-axis) in the Deschutes River at the Oak Springs Hatchery (gray triangles). Overlays are discharge m3/s (blue, second y-axis) and river water temperature (red, third y-axis) over time (x-axis). Mishandled samples are represented by X's. Each point is the mean C. shastadensity from triplicate water samples collected using an automatic sampler (ISCO). Data from 2015 and 2016 were collected and processed by Vojnovich et al., 2016.

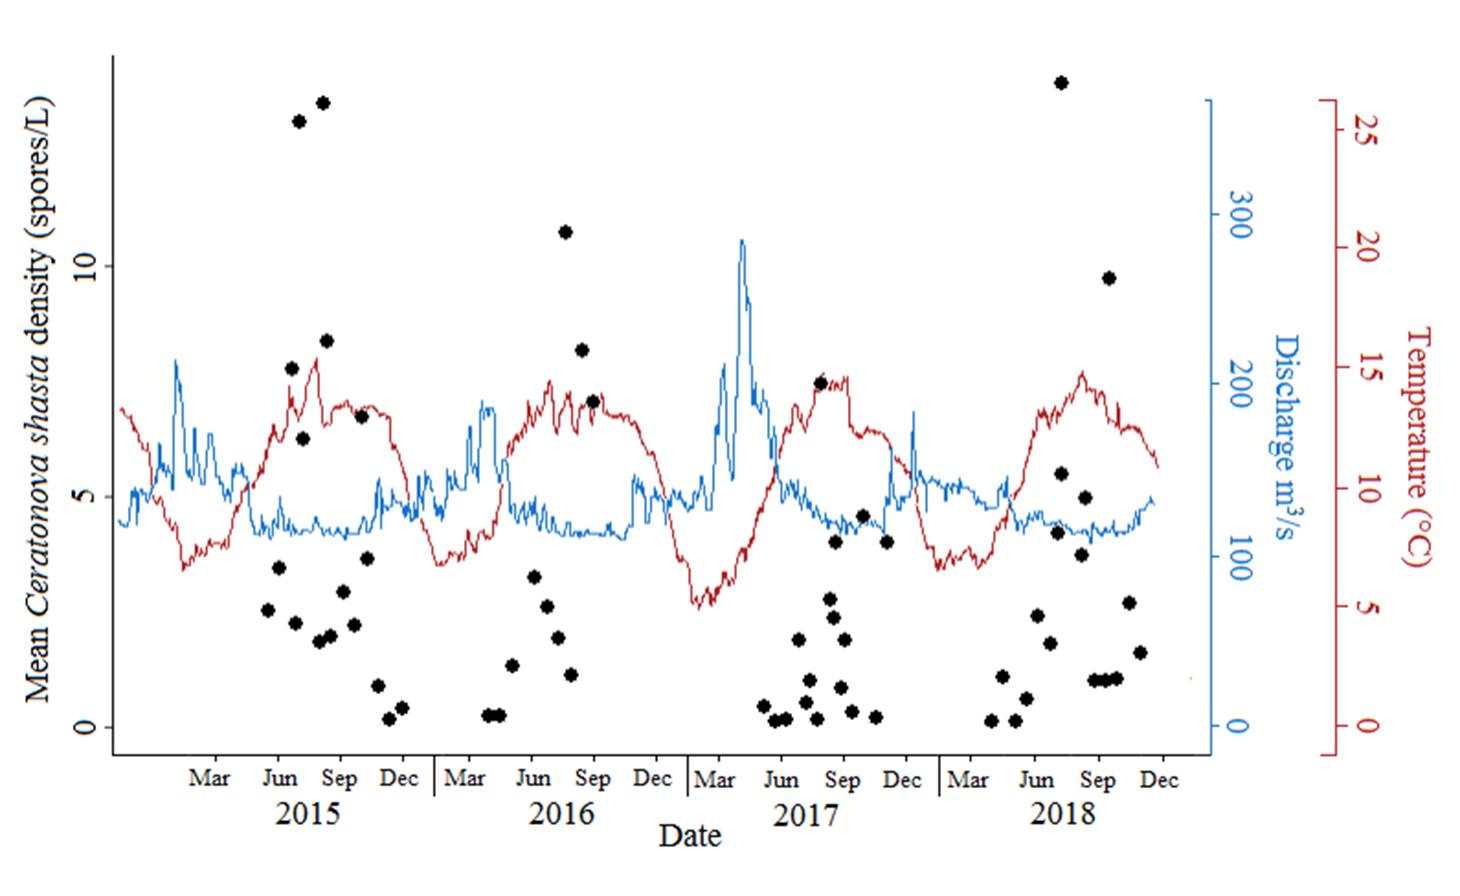
An image of a line chart comparing Mean Ceratonova shasta density (spore/L) with Discharges and Temperature at Pelton Trap.

Mean Ceratonova shasta density (y-axis) in the Deschutes River at the Pelton Trap (black circles). Overlays are discharge m3/s (blue, second y-axis) and river water temperature (red, third y-axis) over time (x-axis). Each point is the mean C. shasta abundance from triplicate water samples collected using an automatic sampler (ISCO). Data from 2015 and 2016 were collected and processed by Vojnovich et al., 2016.

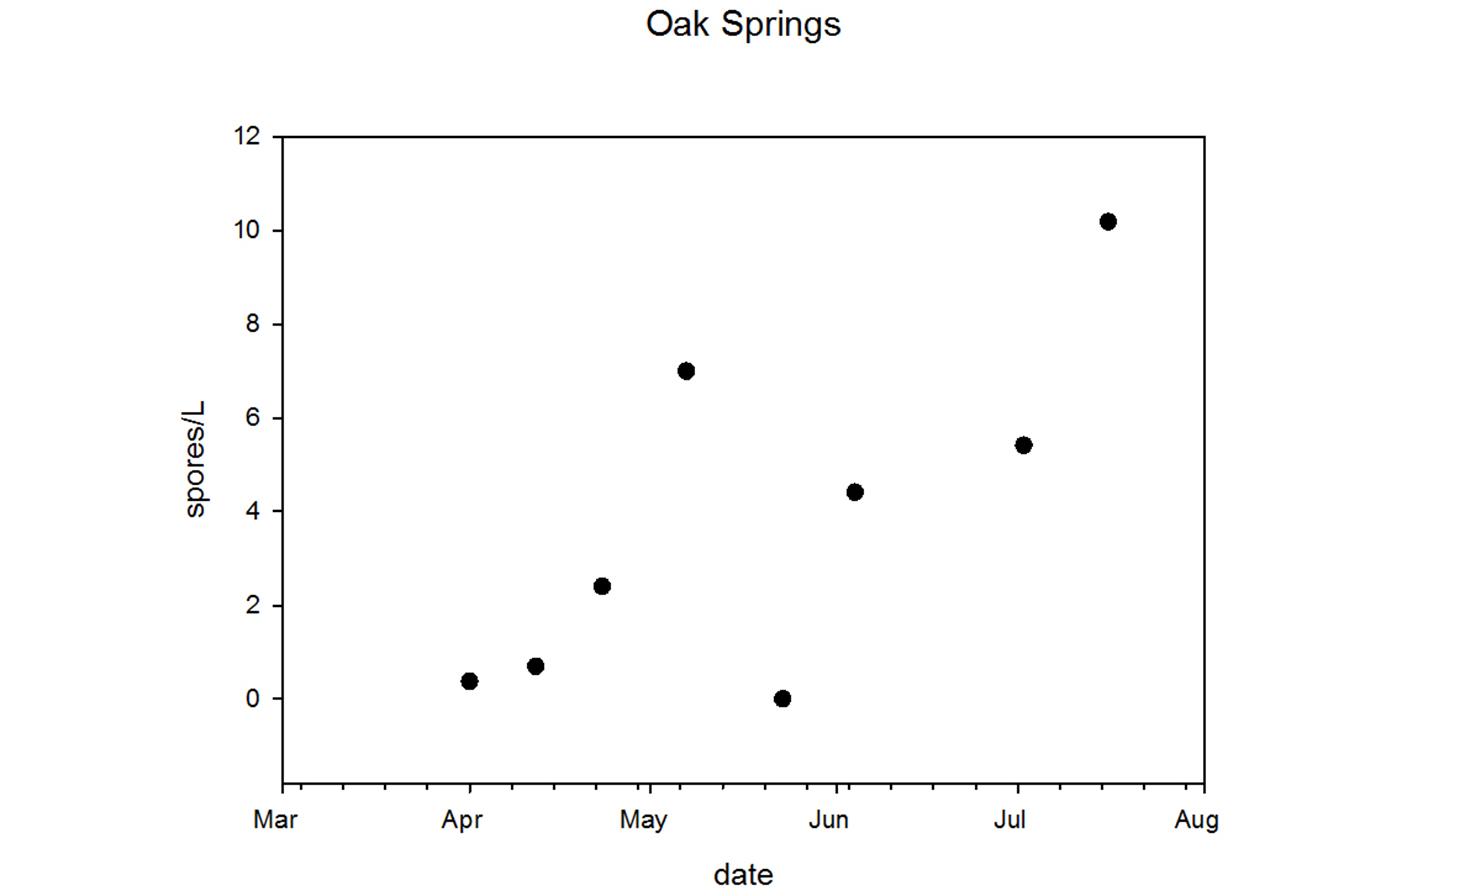
An image of a scatterplot chart comparing spores/L with the date collected in Oak Springs.

Mean Ceratonova shasta density (y-axis) in the Deschutes River at the Oak Springs Hatchery (gray triangles). Each point is the mean C. shasta density from triplicate water samples collected using an automatic sampler (ISCO).

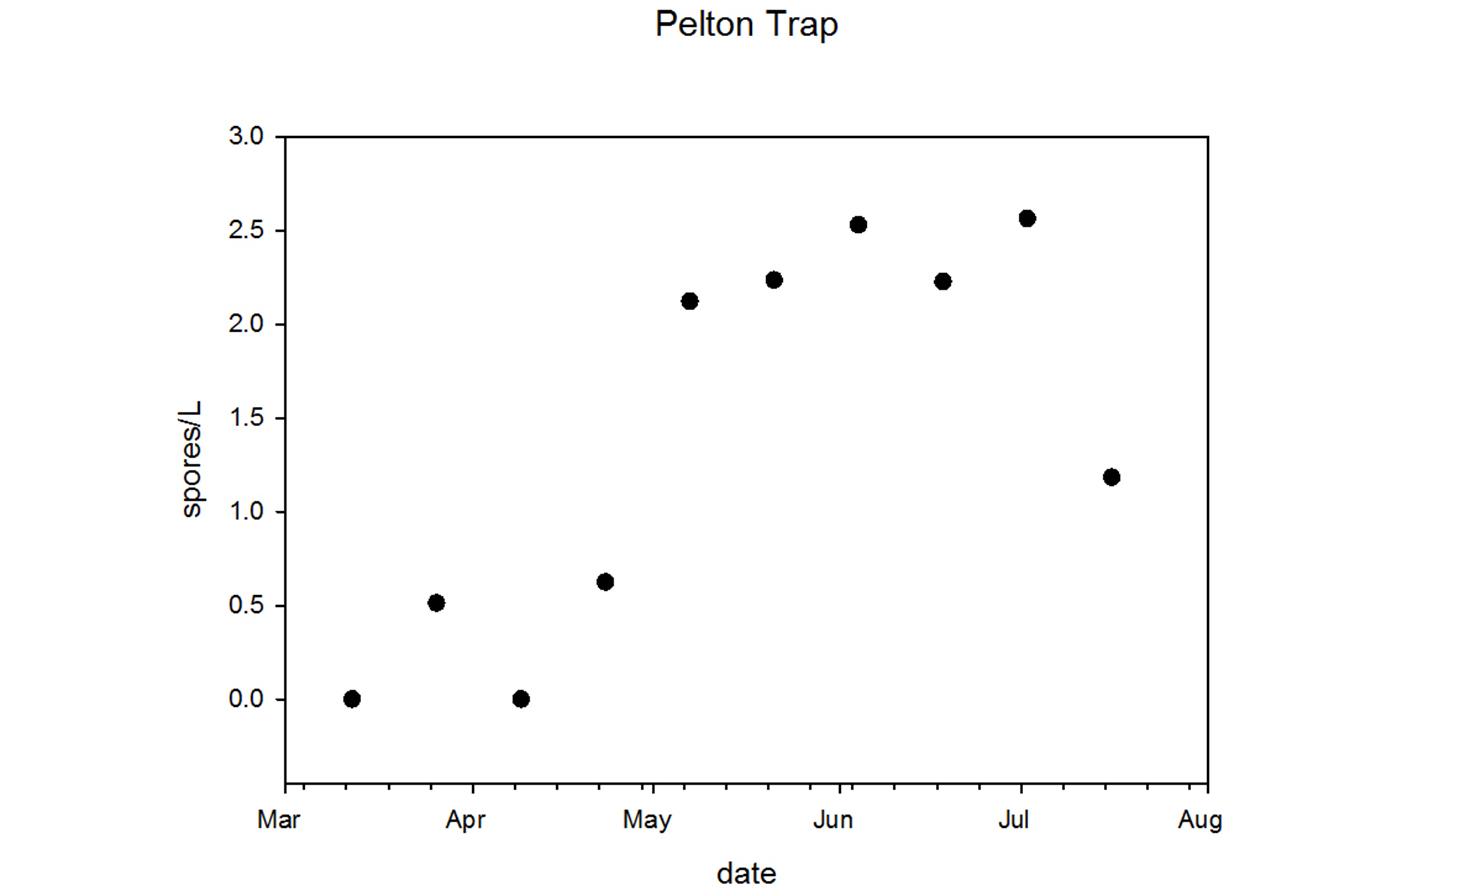
An image of a scatterplot chart comparing spores/L with the date collected in Pelton Trap.

Mean Ceratonova shasta density (y-axis) in the Deschutes River at the Pelton Trap (black circles). Each point is the mean C. shasta abundance from triplicate water samples collected using an automatic sampler (ISCO).

Water sample monitoring on the Warm Springs River

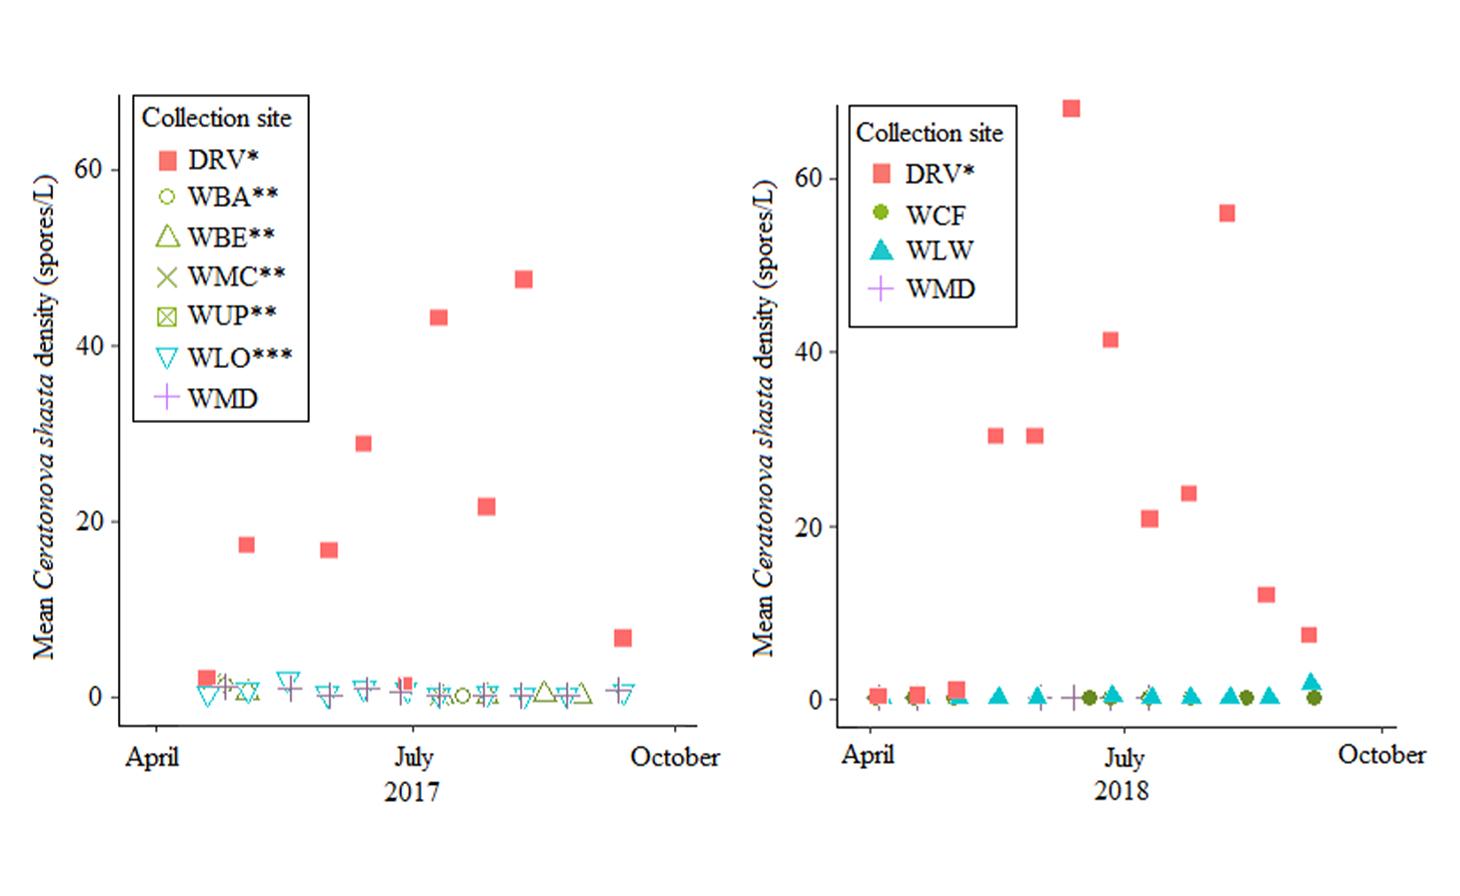
An image of a scatterplot chart comparing Mean Ceratonova shasta density (spores/L) with the dates collected in 2017, next to an identical scatterplot chart with results from 2018.

2017 Warm Springs River temporal water sample monitoring sites. Each data point is the mean Ceratonova shasta spores/L from 3 1L replicate samples. *Note that DRV is located on the Deschutes River at the mouth of the Warm Springs River. ** 2017 sites WBA, WBE, WMC, and WUP were combined as WCF in 2018. ***2017 site WLO was moved further downstream and renamed WLW in 2018.

2018 Warm Springs River temporal water sample monitoring sites. Each data point is the mean Ceratonova shasta spores/L from 3 1L replicate samples. *Note that DRV is at the confluence of the Warm Springs River and the Deschutes River mainstem.

Longitudinal Water Sampling Schedule

  • August 17th, 2015
  • June 7th and August 30th, 2016
  • June 6th and August 30th, 2017
  • May 2nd, June 5th, July 10th and August 29th, 2018
  • June 13th and August 30th, 2019
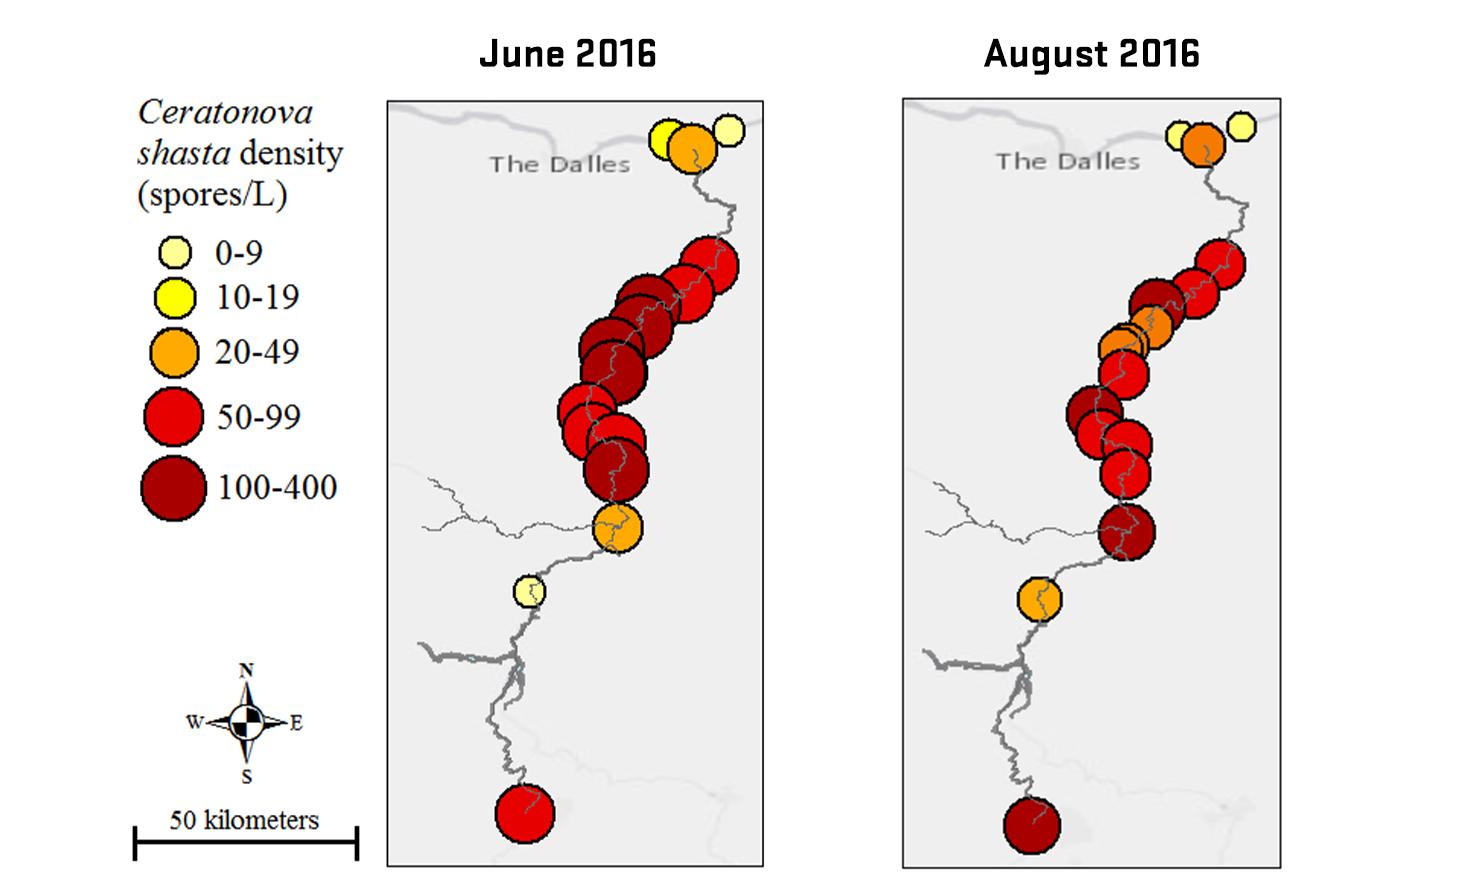
Two side-by-side maps of the Deschutes River labeled with Ceratonova shasta density (spores/L) by sample sites in red, orange and yellow. Comparing results from June and August 2016.
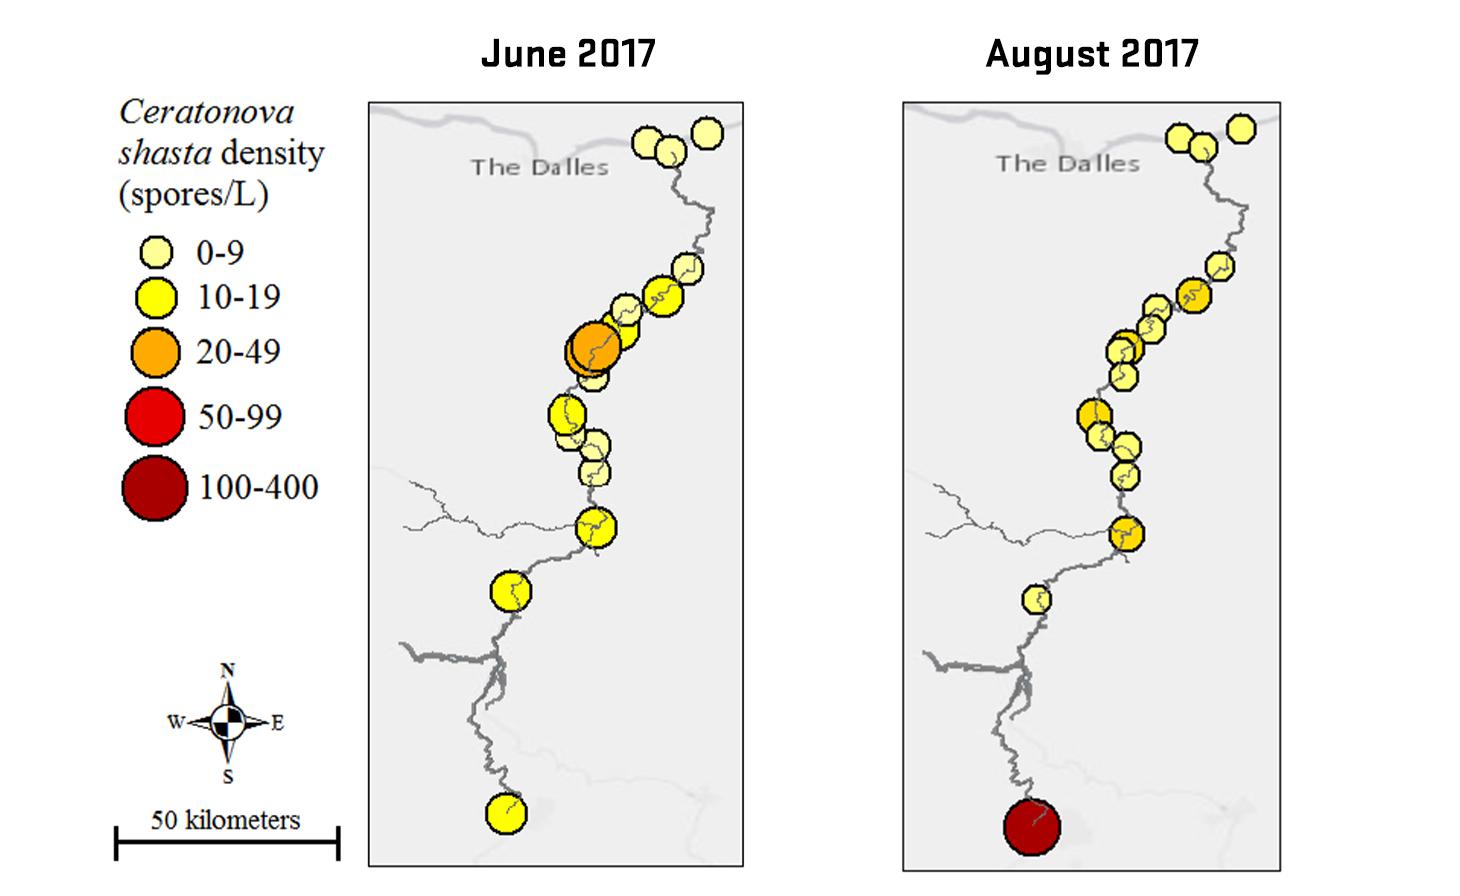
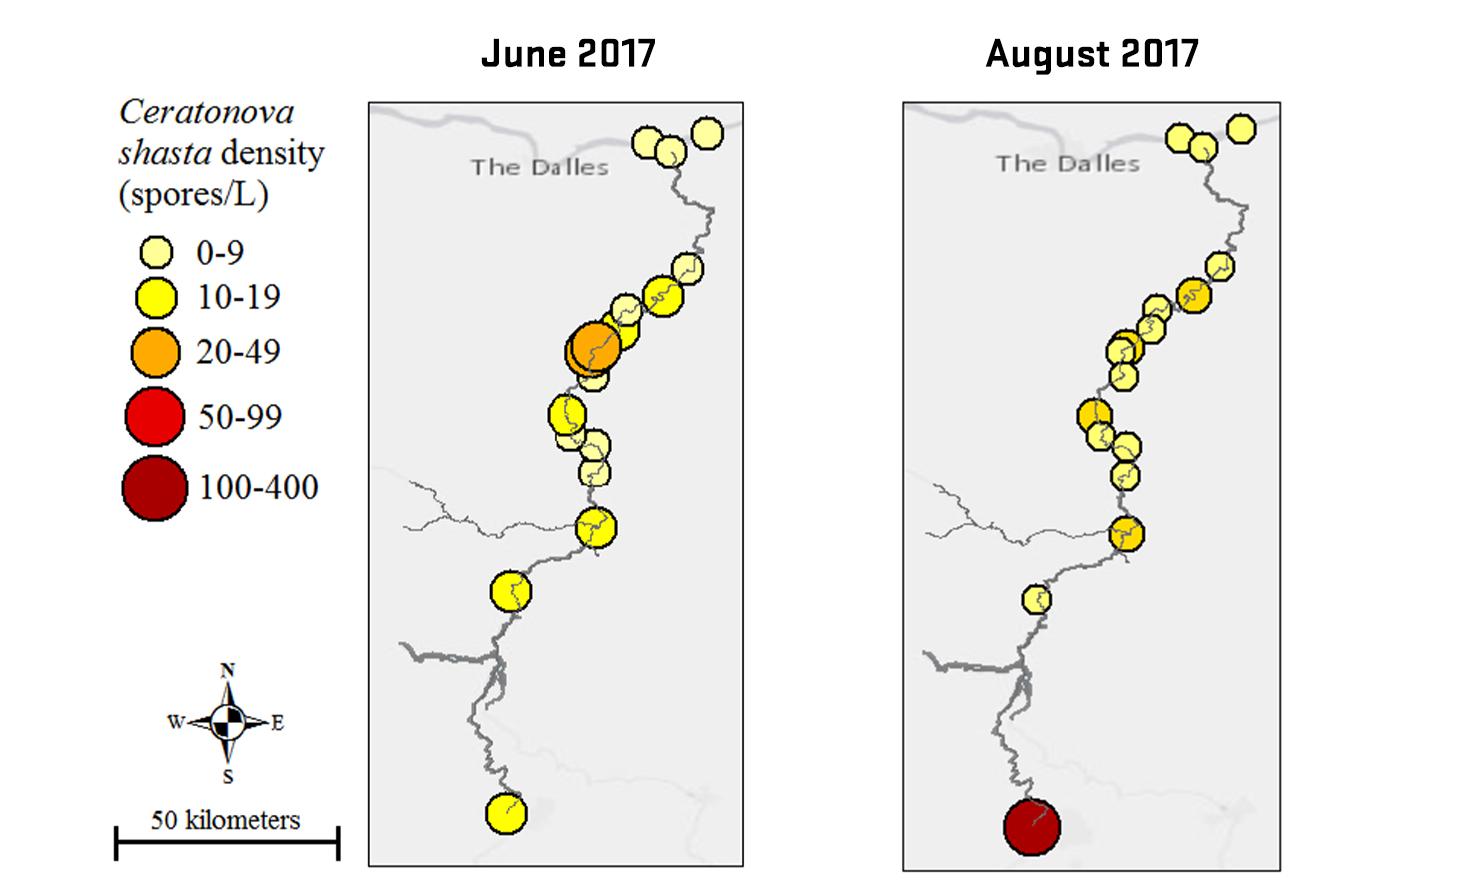
Two side-by-side maps of the Deschutes River labeled with Ceratonova shasta density (spores/L) by sample sites in red, orange and yellow. Comparing results from June and August 2017.
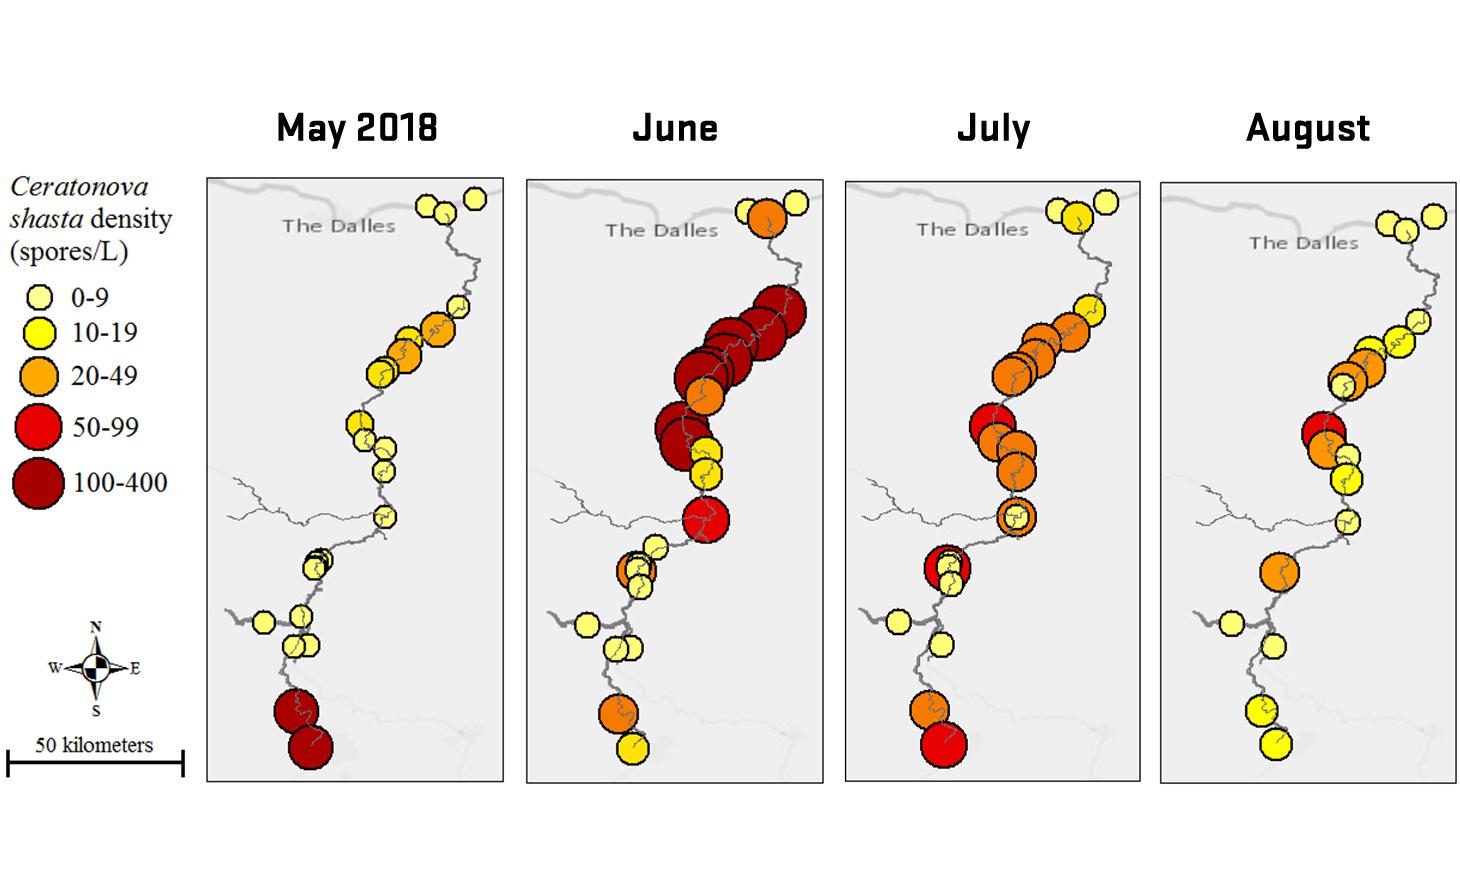
Four side-by-side maps of the Deschutes River labeled with Ceratonova shasta density (spores/L) by sample sites in red, orange and yellow. Comparing results from May, June, July, and August 2018.
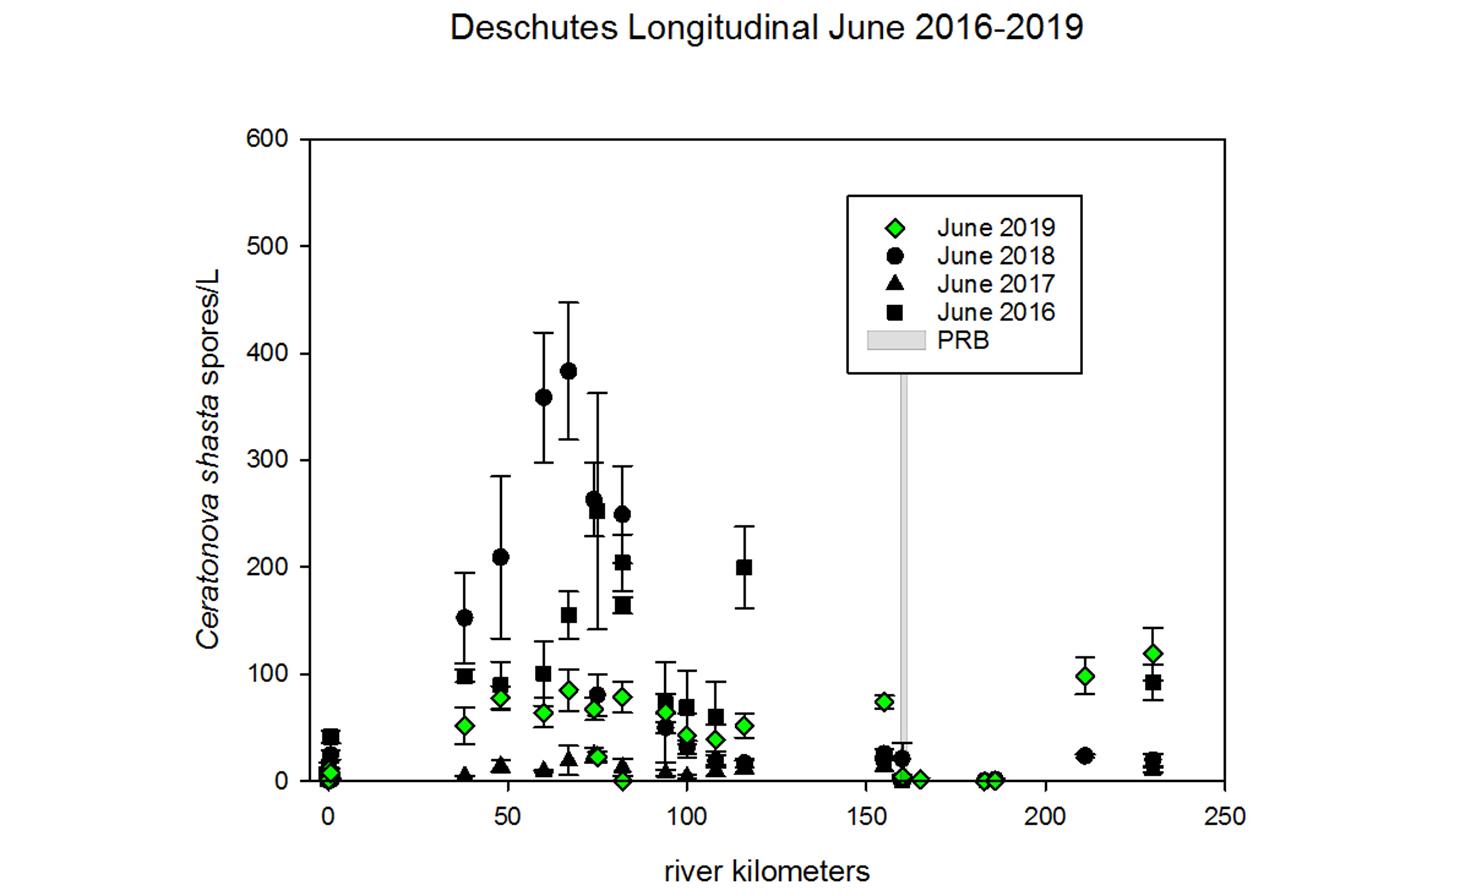
An image of a scatterplot chart comparing Creatonova shasta spores/L with river kilometers from 2016-2019 in June.
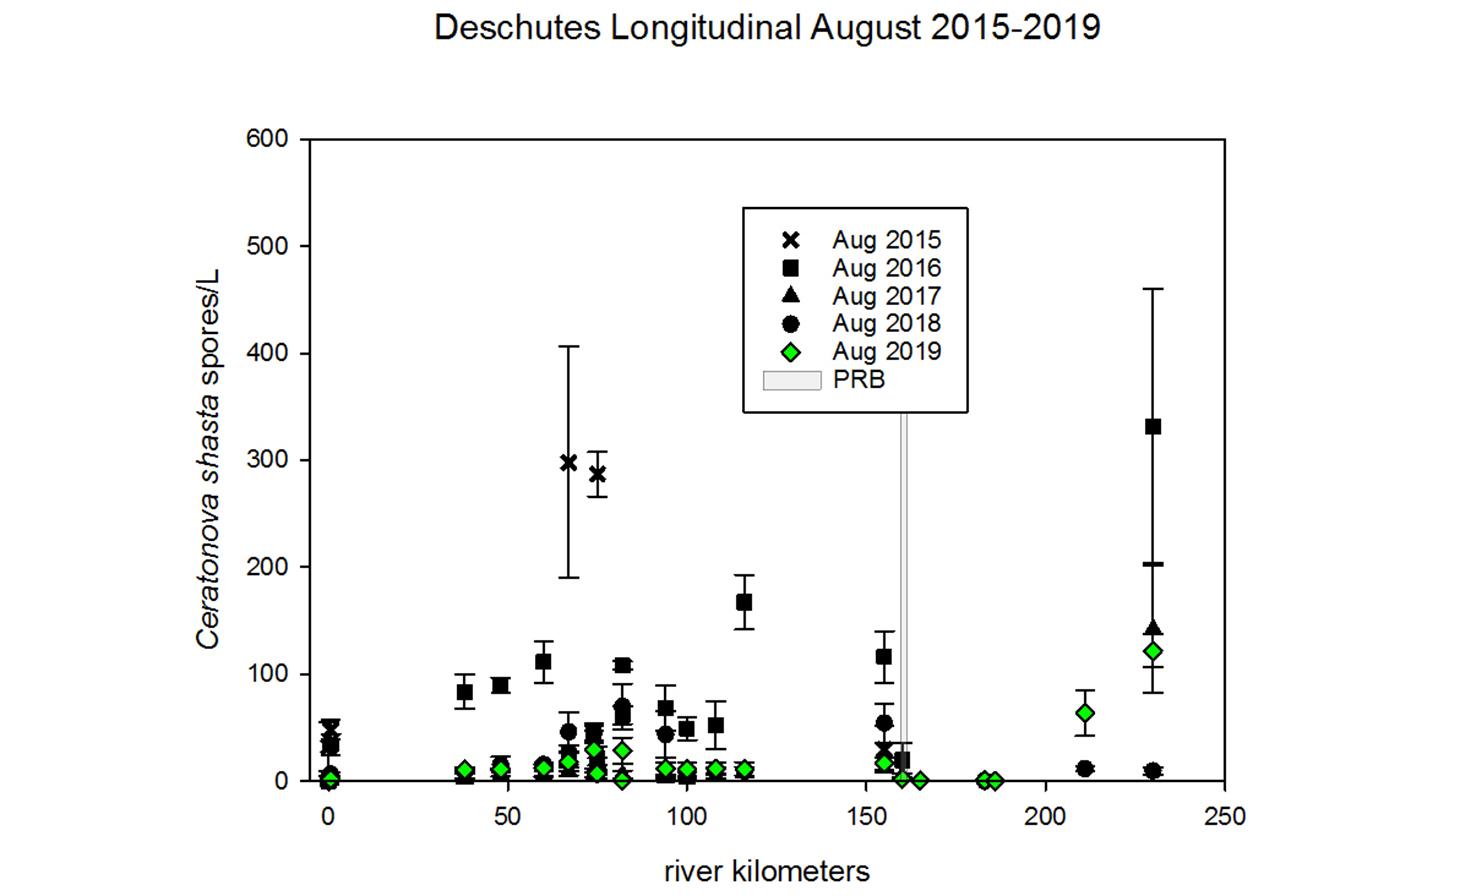
An image of a scatterplot chart comparing Creatonova shasta spores/L with river kilometers from 2015-2019 in August.

Genotyping

There are multiple genetic types of C. shasta simultaneously present in the Deschutes River Basin (Stinson & Bartholomew 2012). While genotype I infects our target species (Chinook salmon) most commonly, we will be analyzing samples for all genotypes of C. shasta. We do this by amplifying the variable ITS1 region using a PCR assay and then we sequence that amplicon (Atkinson & Bartholomew 2010). From the sequencing chromatogram, we can determine the proportion of each genotype present in a sample. We use the total spore density to then determine the number of spores of each genotype in a sample.

Thus, in addition to determining the abundance of total C. shasta in the river, we will also determine the relative proportions of the various genotypes and their spatial and temporal distributions. These data will be aligned with salmonid migration (juveniles and adults) to investigate whether parasite genotype abundance corresponds with the life history of its salmonid host.

Predicted genotypes

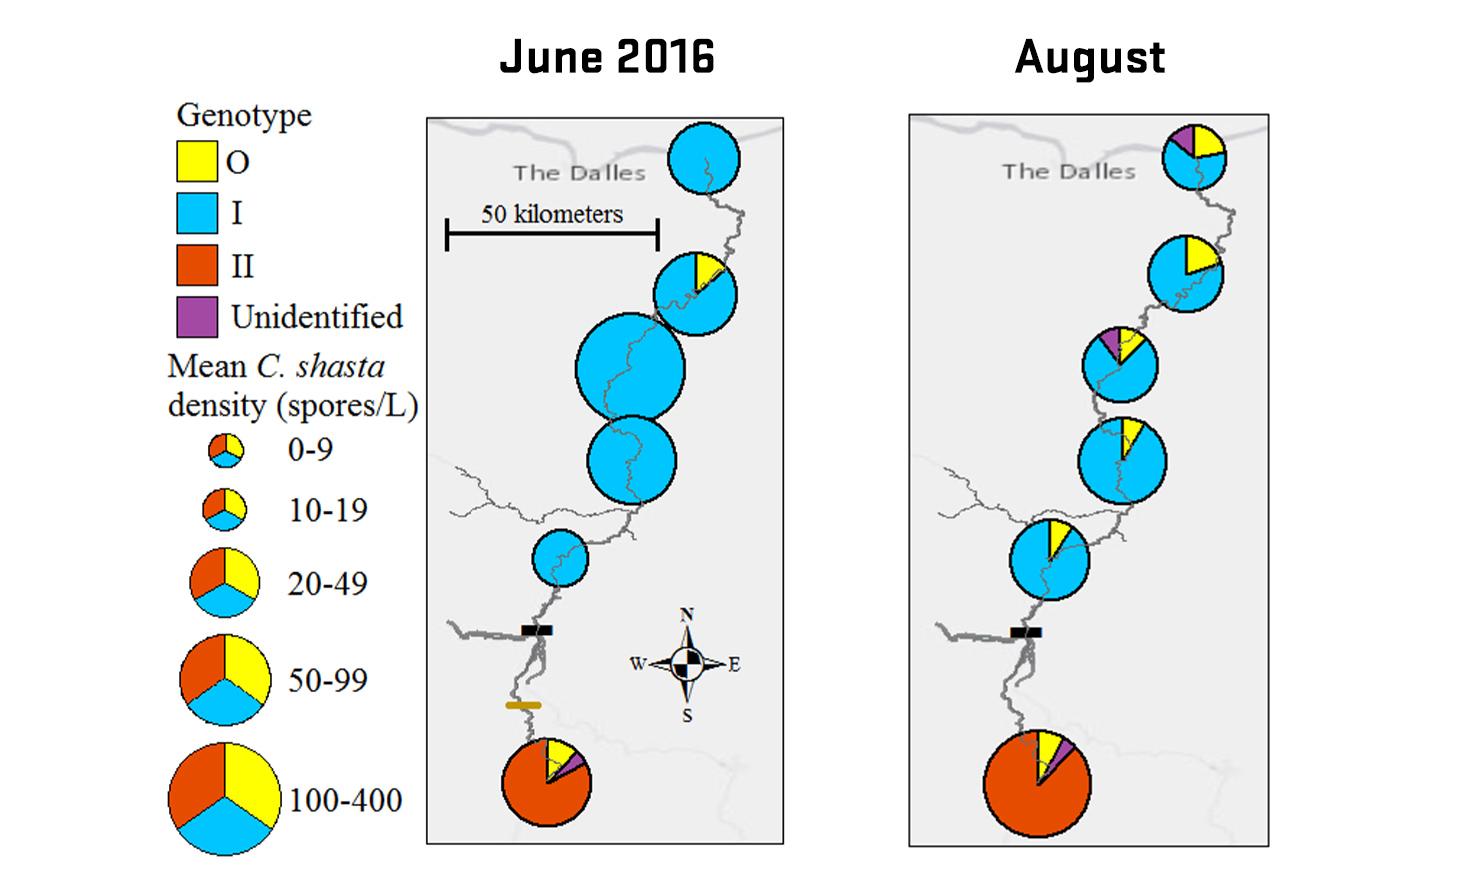
Our hypotheses were that C. shasta genotype abundance and corresponding salmonid host abundance would be correlated. We also explored the hypotheses from Stinson and Bartholomew (2012) that there would be a correlation between the spatiotemporal distribution of genotypes and salmonid hosts with type I in the upper basin (between the Round Butte Dam and DBF) with the reintroduction of Chinook salmon. Using fish passage data provided by PGE in combination with genotyped fish tissue data from Stinson and Bartholomew (2012), the expected results of these hypotheses are displayed graphically below. This figure does not account for resident trout populations (which carry type O and II) as they have not been quantified in the Deschutes River.

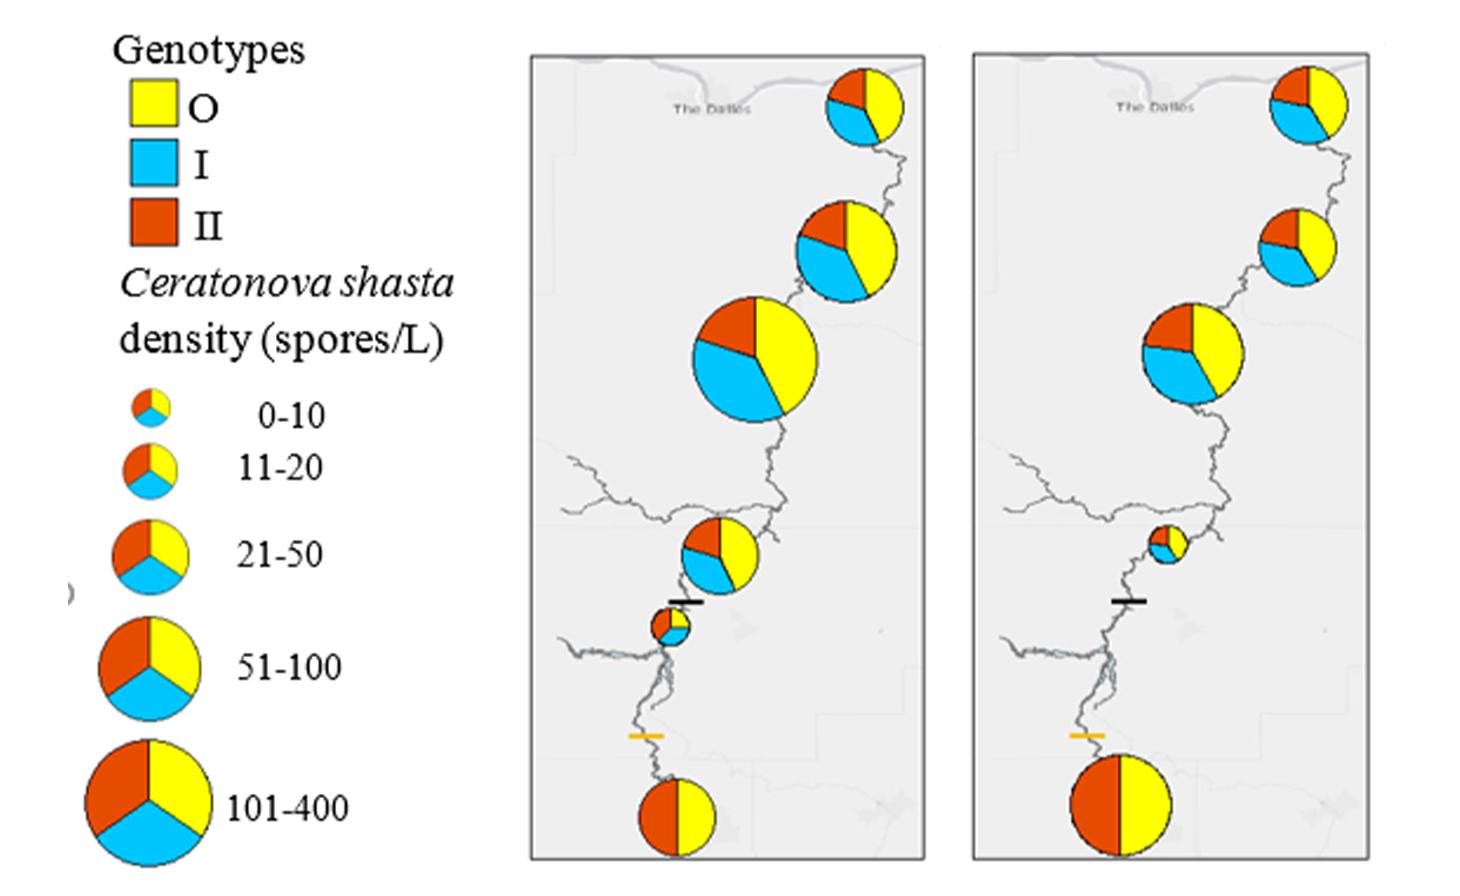
Two side-by-side maps of the Deschutes River labeled with Ceratonova shasta density (spores/L) by sample sites in red, blue and yellow pie charts indicating range of density.

Expected distribution and density of the salmonid parasite Ceratonova shasta in the upper and lower Deschutes River Basin if all proposed hypotheses are supported. The black bar represents the Round Butte Dam complex, a migration barrier for anadromous fish. The relative area of each pie graph indicates the density of Ceratonova shasta in 1L water samples whereas the color in each graph represents the genotype proportions at each site.

Two side-by-side maps of the Deschutes River labeled with Ceratonova shasta density (spores/L) by sample sites in red, blue and yellow pie charts indicating range of density. Comparing June and August of 2016.
Two side-by-side maps of the Deschutes River labeled with Ceratonova shasta density (spores/L) by sample sites in red, blue, purple and yellow pie charts indicating range of density. Comparing June and August of 2017.
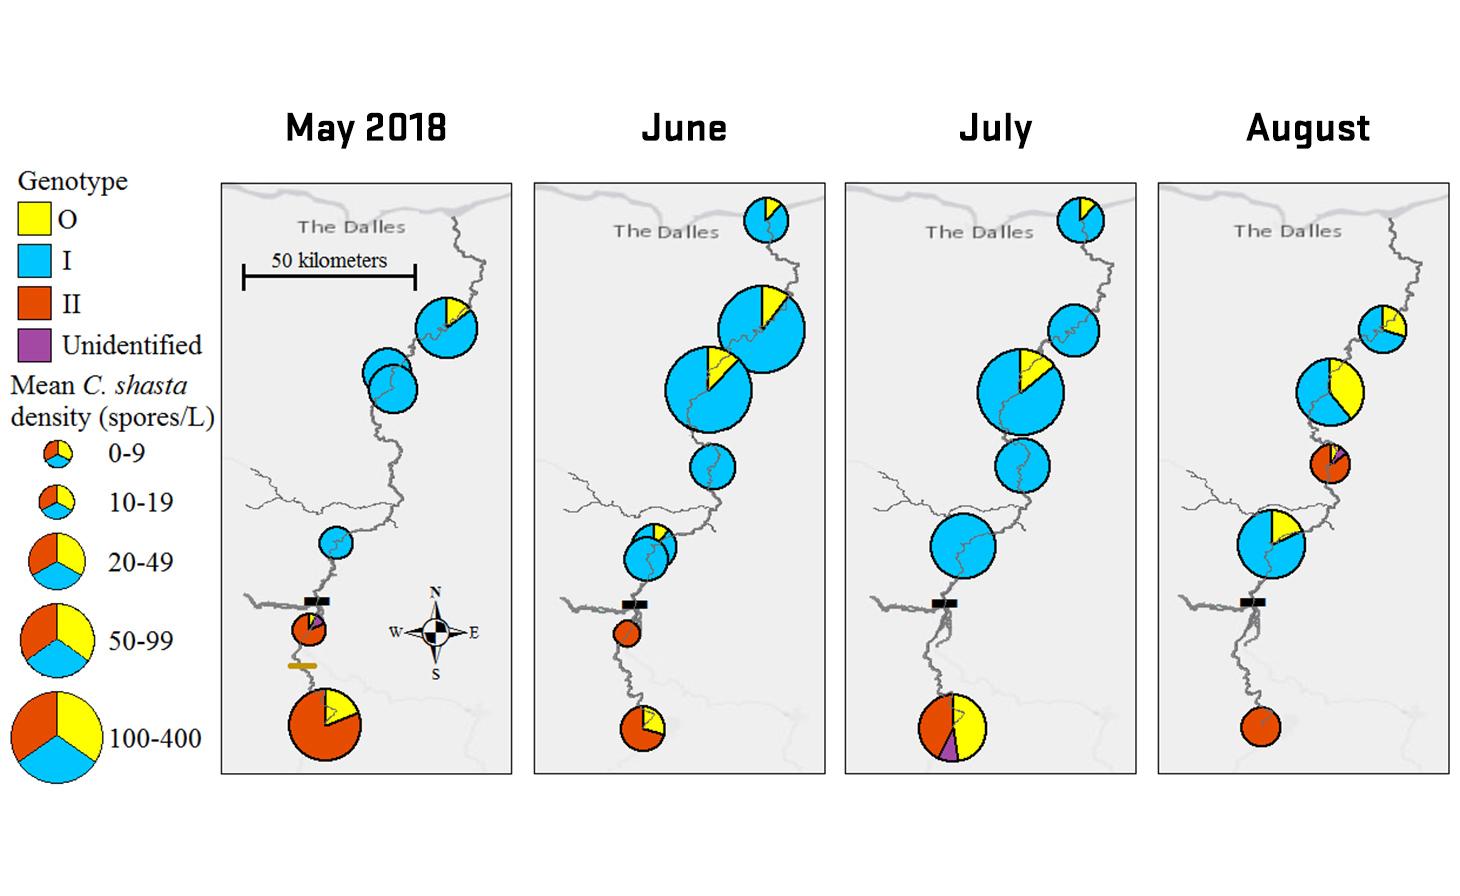
Four side-by-side maps of the Deschutes River labeled with Ceratonova shasta density (spores/L) by sample sites in red, blue, purple and yellow pie charts indicating range of density. Comparing May, June, July and August of 2018.

Invertebrate host studies

In 2019, polychaetes were collected concurrent with the second longitudinal water sampling at a subset of water sites to capture expected variation in polychaete abundance, C. shasta infection prevalence, C. shasta density and geomorphology. Based on the information about spatial distribution of waterborne C. shasta in the Deschutes River in 2015-2019, we targeted three sites from each of three categories: low, moderate, and high C. shasta, stratified throughout the basin. Sampling occurred at 9 different sites along the Deschutes River on August 27th (refer Table 3). Three samples were collected at each site using Hess. Sorting of the samples in the laboratory is underway.

References

Atkinson and Bartholomew (2010) Disparate infection patterns of Ceratomyxa shasta (Myxozoa) in rainbow trout Oncorhynchus mykiss and Chinook salmon Oncorhynchus tshawytscha correlate with ITS­1 sequence variation in the parasite. International Journal for Parasitology 40:599­604

Hallett SL, Bartholomew JL (2006) Application of a real-time PCR assay to detect and quantify the myxozoan parasite Ceratomyxa shasta in river water samples. Diseases of Aquatic Organisms 71:109-118.

Hallett SL, Ray RA, Hurst CN, et al. (2012) Density of the waterborne parasite Ceratomyxa shasta and its biological effects on salmon. Applied and Environmental Microbiology 78:3724–3731.

Stinson MET and Bartholomew JL (2012) Predicted Redistribution of Ceratomyxa shasta Genotypes with Salmonid Passage in the Deschutes River, Oregon. Journal of Aquatic Animal Health 24:274-280.

These research efforts are possible through contribution (funding and efforts) provided by: CTWSRO, CRITFC-PCSRF (research and graduate support 2017-2018), ODFW (Graduate Fellowship 2015-2016 & 2017-2018), LCRFHC-USFWS

For an overview of Deschutes River studies (sentinel fish exposures and water sampling) conducted in 2015 and 2016, please click on the following link: “ODFW Fellowship Report 2015-2016”

For further details about the research conducted in 2017 and 2018, please refer to Kalyn Hubbard's MS thesis: Spatiotemporal Distribution of Ceratonova shasta and its Genotypes in the Deschutes River Basin

2019 Annual report

2017-2018 Final Report

Data shared here are preliminary and subject to modification.

Image credits: Kalyn Hubbard, Stephen Atkinson.