Fish Pathogen Monitoring Studies
Fish Pathogen Monitoring Studies
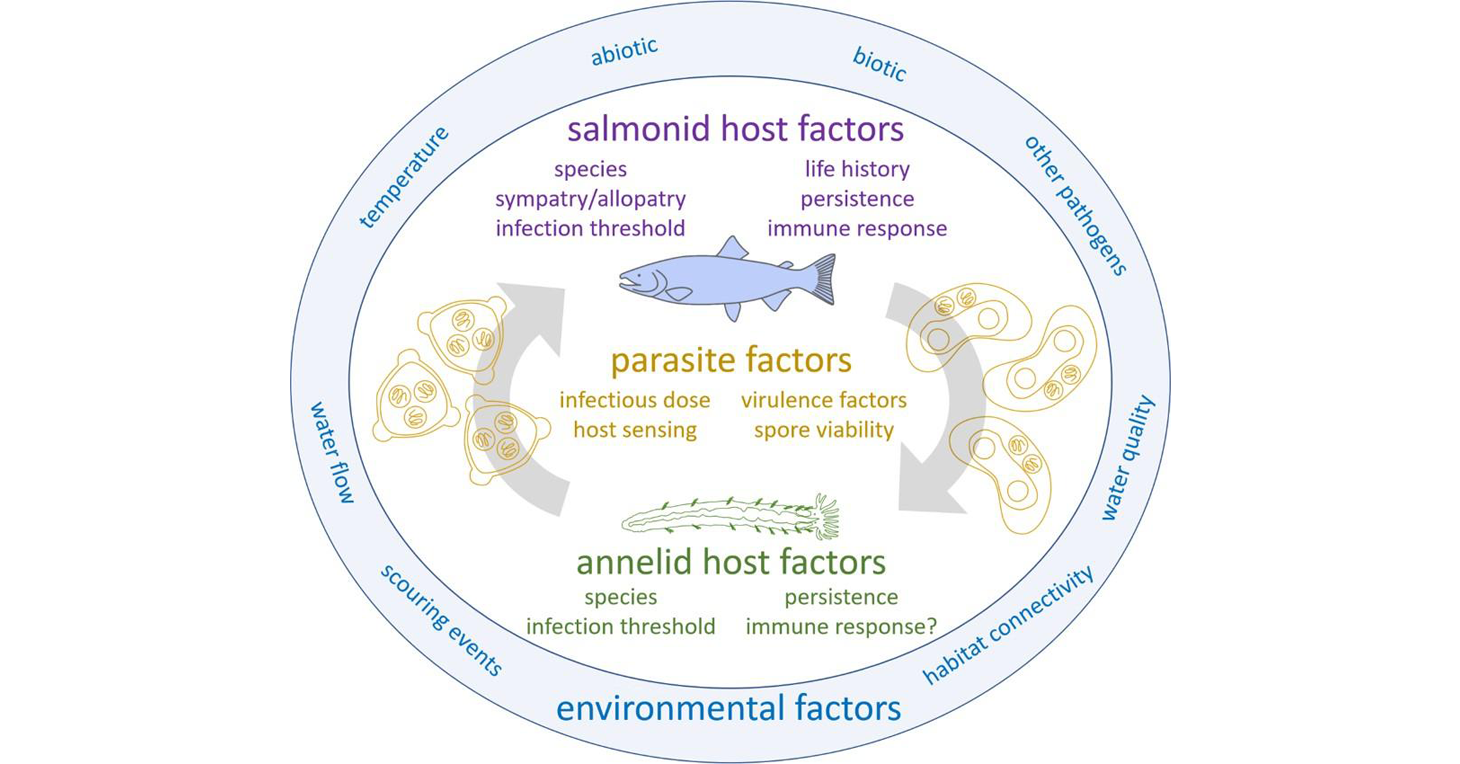
The life cycle of Ceratonova shasta and abiotic and biotic factors that influence the different stages. Published in: Bartholomew JL, Alexander JD, Hallett SL, Alama-Bermejo G, Atkinson SD (2022). Ceratonova shasta: a cnidarian parasite of annelids and salmonids. Parasitology 149, 1862–1875. https://doi.org/10.1017/S0031182022001275
Ceratonova shasta is a freshwater, myxozoan parasite that is native to the Pacific North West of North America. It causes enteronecrosis in juvenile salmonids and is associated with population-level impacts in the Klamath River. Transmission occurs through waterborne stages: actinospores released from annelids infect salmonid fishes and develop into myxospores which then infect annelids (see life cycle, above). The parasite proliferates in each host.
In response to the high prevalence and severity of C. shasta-infection in Klamath salmonids, we developed a parasite monitoring program to track the spatial and temporal abundance of C. shasta. The three main approaches are based on the parasite's life cycle and include sentinel fish exposures, annelid host sampling and molecular quantification of parasite DNA in water samples. These are described in more detail below. Monitoring occurs at established index sites which are shown on the following map.
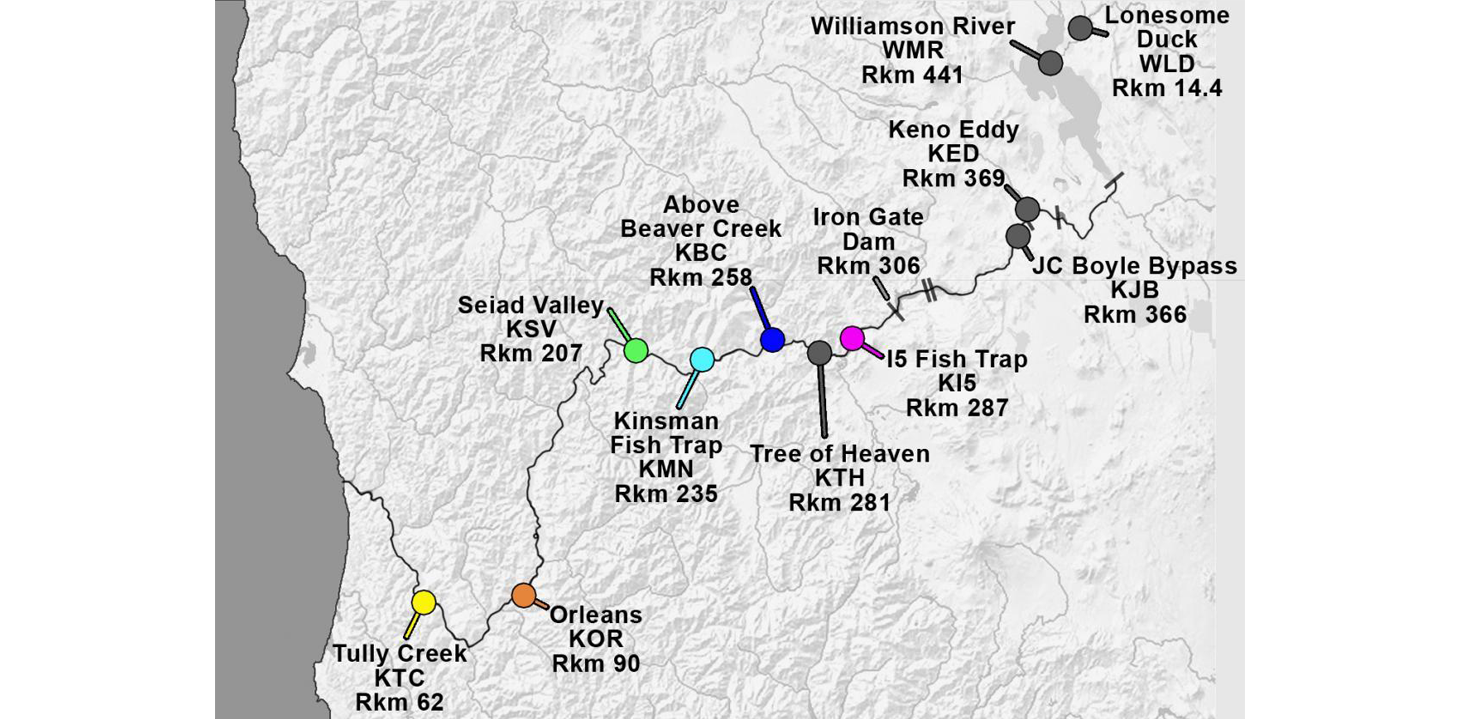
Klamath River Index Sites with site abbreviations and river kilometers (Rkm). Iron Gate Dam (Rkm 306) blocks anadromous salmonid migration.
Data shared here are preliminary and subject to modification.
Page photo credits: S Atkinson, S Hallett & J Alexander
Monitoring Studies are Primarily Supported by the Bureau of Reclamation.
Sentinel fish exposures
In sentinel fish exposures, fish highly susceptible to the parasite (out-of-basin rainbow trout) are placed in cages alongside fish of interest such as in-basin Chinook and coho salmon at index sites along the river for a three day exposure. All fishes are transported to OSU's John L Fryer Aquatic Animal Health Lab and monitored for infection (~ 60 days). Severity of infection (percent morbidity and mean days to morbidity) are recorded through visual observations and molecular assay (PCR).
Juvenile fish being placed in a sentinel cage which is then submerged in the Klamath River
2026 data updates
The first sentinel fish exposure for 2026 is being planned for April. Sites and species will depend upon fish availability.
Details to be determined and will depend upon hatchery fish availability.
Details to be determined and will depend upon hatchery fish availability.
Water samples
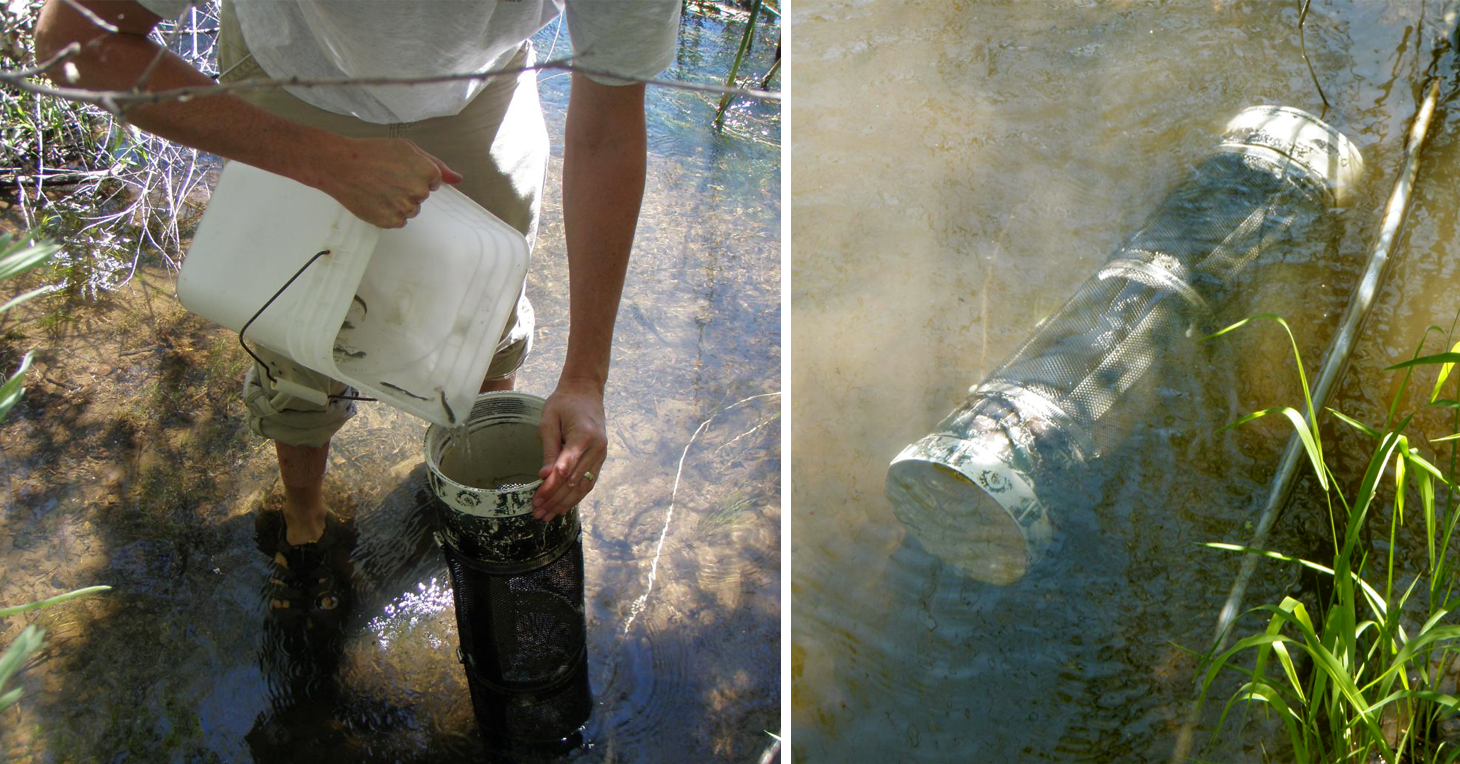
To detect and quantify waterborne stages of C. shasta, river water samples are collected at five mainstem index sites; once a week all year round at two sites (KBC and KSV) and once per week from April through October at three other sites. Solar-powered automatic samplers (ISCOs) collect 1L water every 2 hours for 24 hours, from which 4 1L samples are manually taken (see photos below). Each 1L sample is filtered through a nitrocellulose membrane using a vacuum pump, and any captured DNA in 3 of the replicate samples is extracted using a kit (see images on right). A quantitative PCR (qPCR) specific for C. shasta is used to detect and quantify any parasite DNA present. Cq values generated by the qPCR are converted to numbers of parasite spores per liter of water using reference samples with known quantities of spores. The Karuk and Yurok tribal biologists are integral to the collection and filtration of the water samples. Water samples are also taken in conjunction with the sentinel fish exposures; manual 'grab' samples are collected on the first and last day of the exposure. Data are presented as the average spores per liter of three replicate 1 liter water samples collected at each site and time.
Genotyping
There are multiple genetic types or genotypes of C. shasta simultaneously present in the Klamath River. These differentially disease the various salmonid species. For example, type I causes mortality in Chinook salmon whereas type II can be fatal for coho salmon. Type 0 is found in sympatric Oncorhynchus mykiss (steelhead and redband rainbow trout).
Therefore, we also genotype each water sample. This is done in two ways. For genotyping type II only, we use a qPCR that amplifies the variable ITS1 region specific to that genotype. Whereas, to determine the overall genotype composition of a sample, we amplify the variable ITS1 region common to all genotypes in a PCR and then sequence that amplicon. From the sequencing chromatogram, we can determine the proportion of each genotype present in a sample. We use the total spore density to then determine the number of spores of each genotype in a sample.
Genotyping commences once we detect greater than 1 spore per liter.
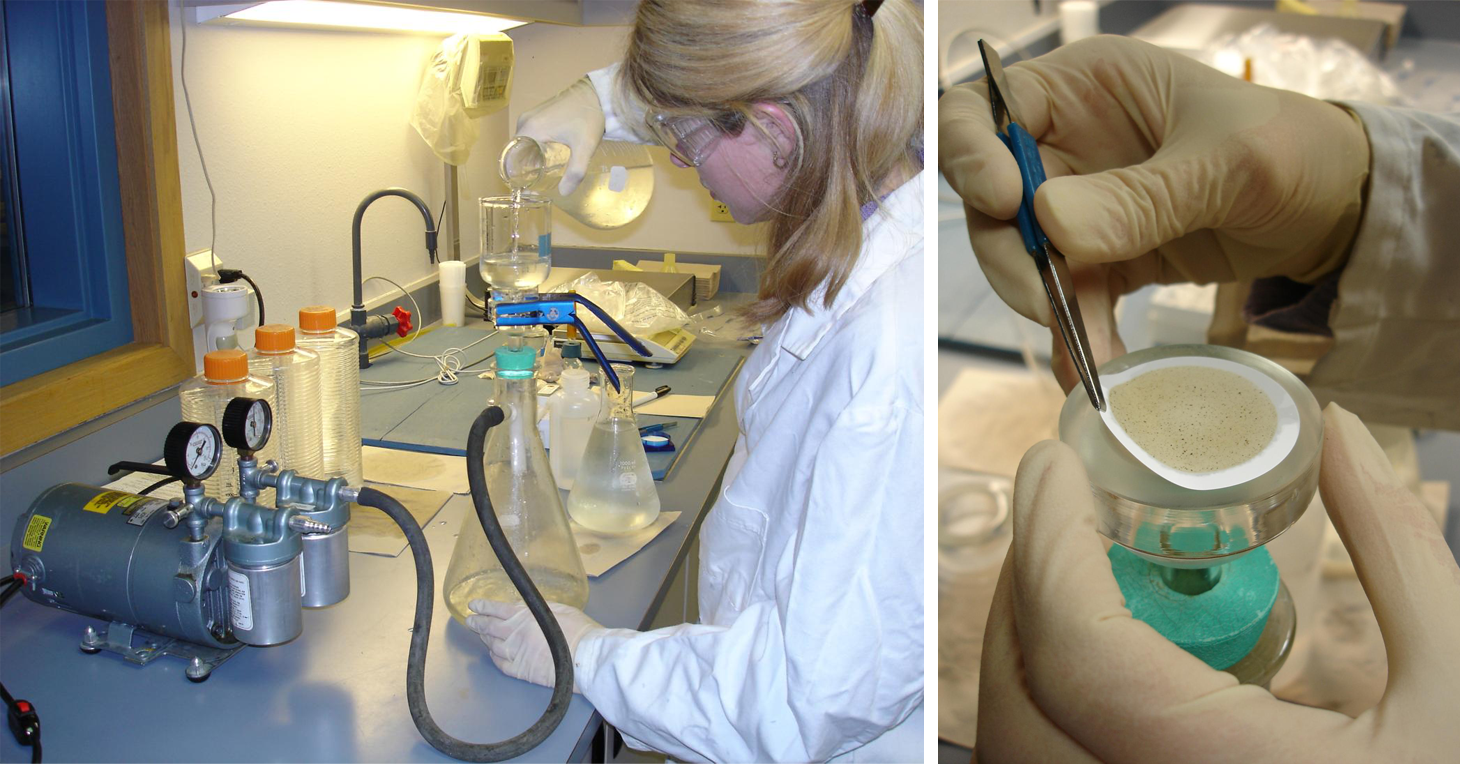
Filtering a water sample using a vacuum pump (left). Folding the filter paper with captured material (right).
2026 data updates
Klamath water sampling and C. shasta spore monitoring has finished its winter season, with collection recommencing at 5 mainstem index sites from 03/02/2026 (KSH, KBC, KMN, KSV, KOR). Turbidity levels continue to be higher than the historic background, with most sites necessitating use of 2 filters, and a reduced volume of sample (as noted below). This turbidity is also reflected in a low level of chemical inhibition that is impacting assay of some samples (however, based on previous years' data - with no/low C. shasta detections until later in March, we interpret the negative/negligible values are true no/v.low levels, despite the effect of the inhibition). We report two metrics for each site/time: (i) the number of bottles (out of 3 1L replicates) in which C. shasta DNA was detected and (ii) the average concentration of C. shasta DNA (in spores per L) in the 3 1L.
Findings: As in previous years, we are detecting our first very low densities of C. shasta in some samples at some sites (as noted below), as the weather warms into Spring. We did not detect any C. shasta DNA in the January and February samples.
Details of samples collected 03/02/2026:
KSH 0/3 samples positive; 0.5L; isco; 0 sp/L total Cs
KBC 0/3 samples positive; 0.5L; isco; 0 sp/L total Cs
KMN 0/3 samples positive; 0.5L, grab; 0 sp/L total Cs
KSV 1/3 samples positive; 0.6-1L, isco; <1 sp/L total Cs
KOR 0/3 samples positive; 1L, grab; 0 sp/L total Cs
Details of samples collected 03/09/2026:
KSH 0/3 samples positive; 0.5L; grab; 0 sp/L total Cs
KBC 1/3 samples positive; 0.5L; grab; <1 sp/L total Cs
KMN 1/3 samples positive; 0.6L, isco; <1 sp/L total Cs
KSV 1/3 samples positive; 0.6L, isco; <1 sp/L total Cs
KOR 0/3 samples positive; 1L, grab; 0 sp/L total Cs
No samples from KTC have yet been received.
Klamath water sampling and C. shasta spore monitoring has begun its peak season routine, with weekly water samples being collected at 6 index sites: KSH, KBC, KMN, KSV, KOR and KTC (the latter from 03/23).
C. shasta was detected at all sites on 3/23 (at densities up to about 1 sp/L). This was followed by a dramatic rise in spore density the following week 3/30, with the lowest average spore density being 3 sp/L at KOR, and the highest 14 sp/L at KBC - with two sites exceeding 10 sp/L and a further two sites at 9 sp/L. This seasonal rise in C.shasta spore density is two weeks earlier than in 2025.
As levels are now above 2 sp/L we also tested samples for C. shasta type 2 (the "coho" genotype); no type 2 was detected in any sample.
Turbidity levels continue to be higher than the historic background, with most sites necessitating use of 2 filters, and a reduced volume of sample (as noted).
Details of samples collected 03/16/2026:
KSH 0/3 samples positive; 1/0.5L; isco; 0 sp/L total Cs
KBC 0/3 samples positive; 0.5L; isco; 0 sp/L total Cs
KMN 0/3 samples positive; 1L, isco; 0 sp/L total Cs
KSV 0/3 samples positive; 1L, isco; 0 sp/L total Cs
KOR 0/3 samples positive; 1L, grab; 0 sp/L total Cs
Details of samples collected 03/23/2026:
KSH 3/3 samples positive; 0.8-1L; isco; <1 sp/L total Cs
KBC 3/3 samples positive; 0.6L; isco; <1 sp/L total Cs
KMN 3/3 samples positive; 0.8L, isco; 1 sp/L total Cs
KSV 3/3 samples positive; 0.9L, isco; 1 sp/L total Cs
KOR 2/3 samples positive; 1L, isco; 1 sp/L total Cs
KTC 2/3 samples positive; 1L, isco; <1 sp/L total Cs
Details of samples collected 03/30/2026:
KSH 3/3 samples positive; 0.7L; isco; 10 sp/L total Cs
KBC 3/3 samples positive; 0.7L; isco; 14 sp/L total Cs
KMN 3/3 samples positive; 0.7L, isco; 9 sp/L total Cs
KSV 3/3 samples positive; 1L, isco; 4 sp/L total Cs
KOR 2/3 samples positive; 1L, isco; 3 sp/L total Cs
KTC 3/3 samples positive; 1L, isco; 9 sp/L total Cs
Klamath water sampling and C. shasta spore monitoring is in its peak season routine, with weekly water samples being collected at 6 index sites: KSH, KBC, KMN, KSV, KOR and KTC. Turbidity levels continue to be higher than the historic background, with most sites necessitating use of 2 filters, and a reduced volume of sample (as noted below).
C. shasta was detected at all sites on 04/06, with the lowest average spore density being 6 sp/L at KOR, and the highest 47 sp/L at KMN - with 4 sites exceeding 10 sp/L. This seasonal rise in C.shasta spore density is earlier than in 2025.
As all sites had spore densities >2 sp/L, samples will be assayed for C. shasta type 2 (the "coho" genotype) (data forthcoming).
Details of samples collected 04/06/2026:
KSH 0.7L; isco; 3/3 samples positive; 36 sp/L total Cs Cs-Coho negative
KBC 1L; isco; 3/3 samples positive; 36 sp/L total Cs Cs-Coho negative*
KMN 0.6L, isco; 3/3 samples positive; 47 sp/L total Cs Cs-Coho <1 sp/L
KSV 0.7L, isco; 3/3 samples positive; 19 sp/L total Cs Cs-Coho negative
KOR 1L isco; 3/3 samples positive; 6 sp/L total Cs Cs-Coho <1 sp/L
KTC 1L, isco; 3/3 samples positive; 7 sp/L total Cs Cs-Coho negative
Note: we added the historic data for KBC in 2021 to the graphs as 2021 was the last year with similar climate characterization as that anticipated for 2026 (warm/dry).
Klamath water sampling and Cs spore monitoring is in its peak season routine, with weekly water samples being collected at 6 index sites: KSH, KBC, KMN, KSV, KOR and KTC. Turbidity levels continue to be higher than the historic background, with most sites necessitating use of 2 filters, and a reduced volume of sample (as noted), with detections of chemical inhibition of some samples (as noted).
C. shasta was detected at all sites on 4/13, with the lowest spore density being 7 sp/L at KOR, and the highest 26 sp/L at KBC - and despite spore levels coming down slightly at the four uppermost sites, these 4 sites still exceeded 10 sp/L this week.
As all sites had total spore densities >2 sp/L, water samples are being assayed for C. shasta type 2 (the "coho" genotype). Only trace levels (<1sp/L) were observed at KBC and KMN.
Details of samples collected 04/13/2026:
KSH 0.8L; isco; 3/3 samples positive; 16* sp/L total Cs
KBC 0.81L; isco; 3/3 samples positive; 26 sp/L total Cs
KMN 0.8L, isco; 3/3 samples positive; 19* sp/L total Cs
KSV 1L, isco; 3/3 samples positive; 13* sp/L total Cs
KOR 1L grab; 3/3 samples positive; 7 sp/L total Cs
KTC 1L, isco; 3/3 samples positive; 7 sp/L total Cs
*samples had some degree of assay inhibition which may have reduced the measured value - the assay will be rerun and data updated for next week.
Note: we added the historic data for KBC in 2021 to the graphs as 2021 was the last year with similar climate characterization as that anticipated for 2026 (warm/dry).
Klamath water sampling and Cs spore monitoring is in its peak season routine, with weekly water samples being collected at 6 index sites: KSH, KBC, KMN, KSV, KOR and KTC. Turbidity levels continue to be higher than the historic background, with all sites necessitating use of 2 filters, and some with s reduced volume of sample (as noted), with detections of chemical inhibition of some samples (as noted).
C. shasta was detected at all sites on 4/20, with the lowest spore density being 6 sp/L at KOR, and the highest 32 sp/L at KSH - 5 sites exceeded 10 sp/L this week.
As all sites had total spore densities >2 sp/L, and samples wera assayed also for C. shasta type 2 (the "coho" genotype). Only trace levels (<1sp/L) were observed at KOR.
Details of samples collected 04/20/2026:
KSH 0.5L; isco; 3/3 samples positive; 32* sp/L total Cs
KBC 0.7L; isco; 3/3 samples positive; 18* sp/L total Cs
KMN 0.7L, isco; 3/3 samples positive; 14* sp/L total Cs
KSV 0.7L, isco; 3/3 samples positive; 19* sp/L total Cs
KOR 1L isco; 3/3 samples positive; 14 sp/L total Cs
KTC 1L, isco; 3/3 samples positive; 6 sp/L total Cs
*samples had some degree of assay inhibition which may have reduced the measured value - the assay will be rerun and data potentially updated in a subsequent report.
Note: we added the historic data for KBC in 2021 to the graphs as 2021 was the last year with similar climate characterization as that anticipated for 2026 (warm/dry).
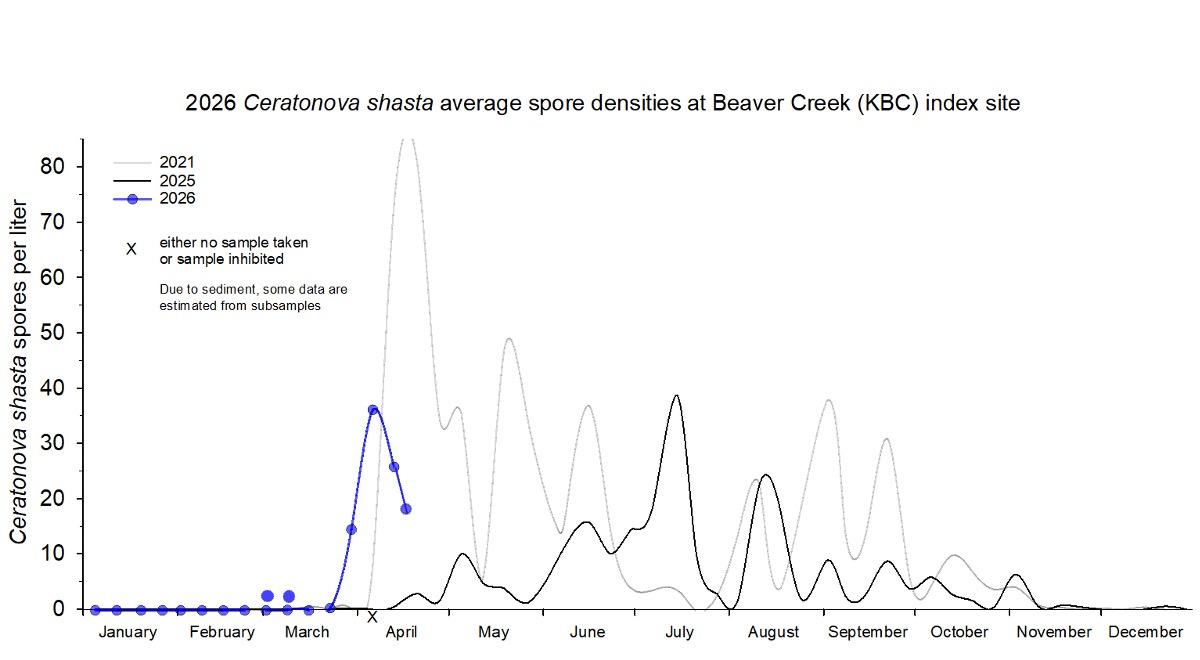
Density (average spores per liter) of Ceratonova shasta in 24-hour composite water samples collected at the mainstem long term index site, near Beaver Creek (KBC) in 2026 (blue data points) compared to two previous years (2021 & 2025).

Density (average spores per liter) of Ceratonova shasta in 24-hour composite water samples collected at the mainstem index sites in 2026. Note that KMN is sampled only during salmonid outmigration, KBC and KSV year round and remaining sites April through October. KBC = near Beaver Creek, KSV = Seiad Valley, KSH = near Shasta River, KTC = Tully Creek, KMN = Kinsman Fish Trap, KOR = Orleans. The line denotes 10 spores per liter which corresponds with 40% mortality threshold in Chinook salmon. Densities at KBC over two previous years (2021 and 2025) are included for reference.

Density (average spores per liter) of Ceratonova shasta in 24-hour composite water samples collected at the mainstem index sites in 2025. Note that KMN is sampled only during salmonid outmigration, KBC and KSV year round and remaining sites April through October. KBC = near Beaver Creek, KSV = Seiad Valley, KSH = near Shasta River, KTC = Tully Creek, KMN = Kinsman Fish Trap, KOR = Orleans. The line denotes 10 spores per liter which corresponds with 40% mortality threshold in Chinook salmon.
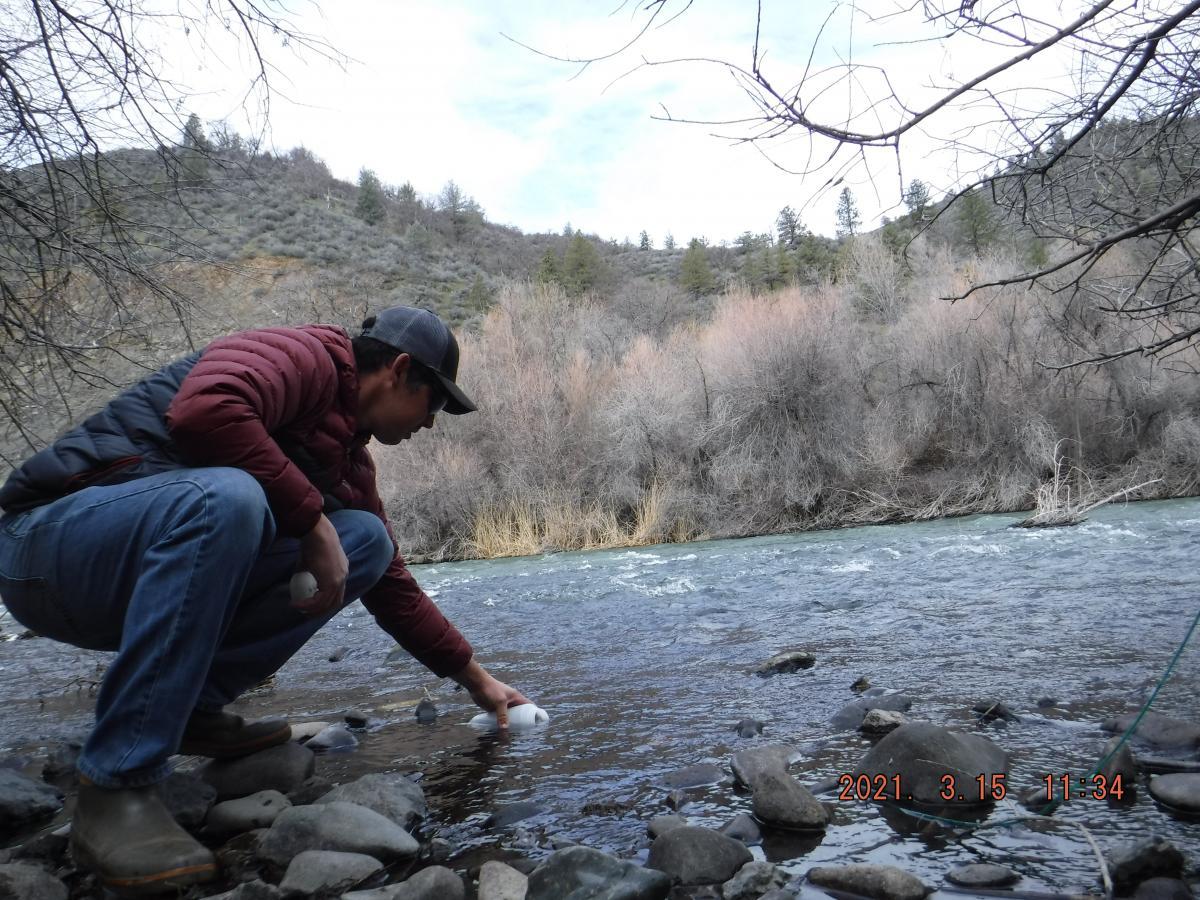
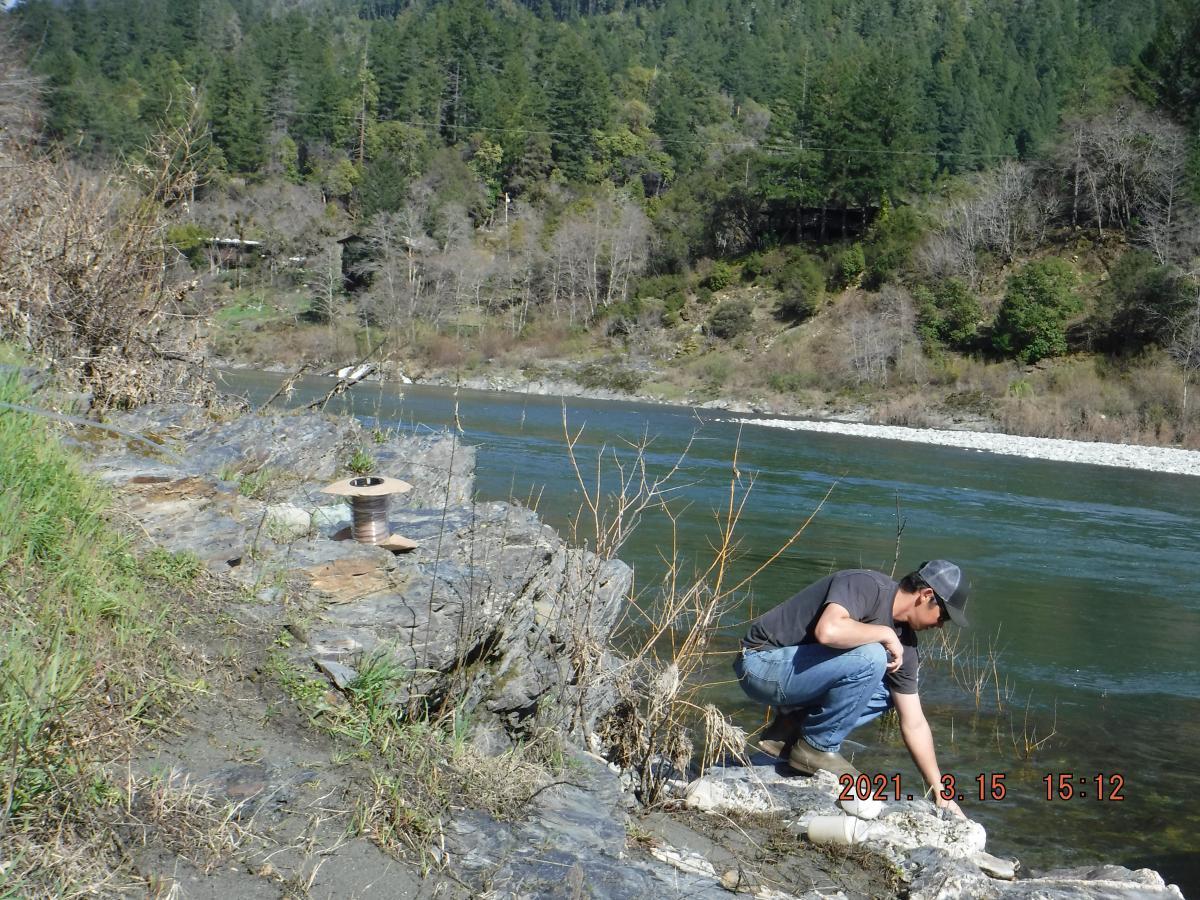
Manual water sampling by Karuk Tribal Biologist Larry Alameda at index site K-I5
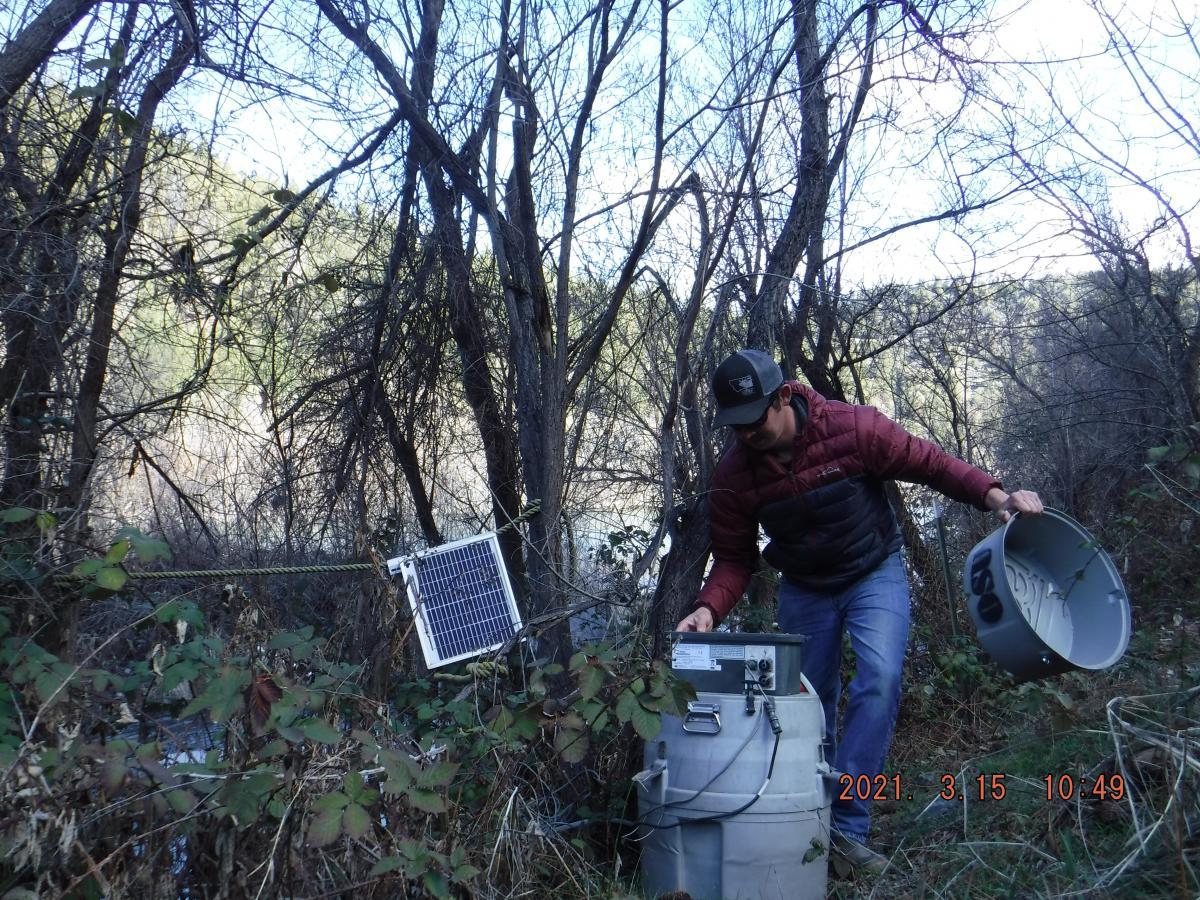
Solar powered automatic sampler at the Kinsman index site. An ISCO is used at all index sites but manual sampling provides a backup.
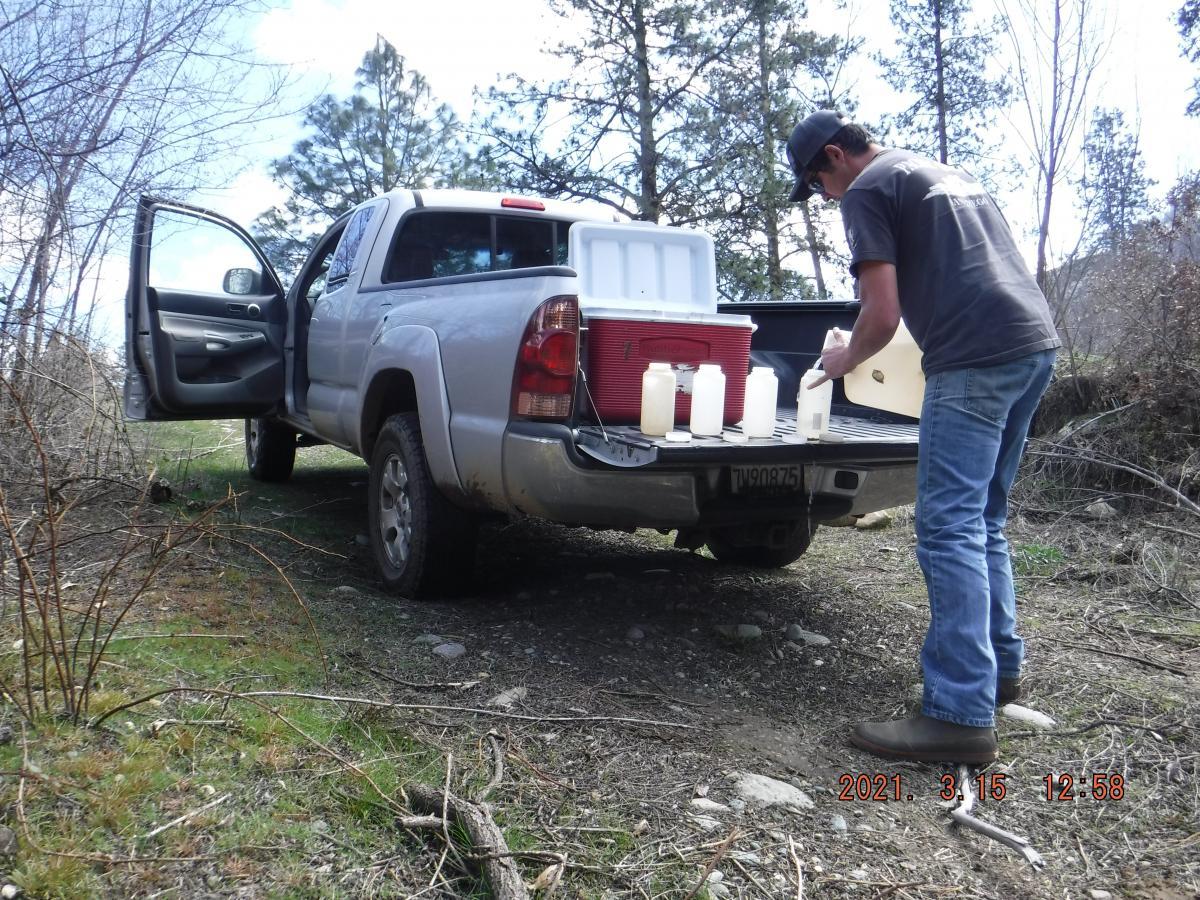
Collection of 4 1L technical replicate water samples from the larger 12L composite collected over 24 hours at KSV
Manual water sampling at Orleans index site.
Photos courtesy of Karuk Tribal Biologist Larry Alameda
Annelid sampling
To monitor abundance and prevalence of C. shasta infection in the invertebrate annelid host, Manayunkia occidentalis, benthic samples are collected at seven sites in the Klamath River in fall, winter, spring, and summer. Sites span a discharge gradient; 2 are located in the upper basin downstream from Keno Dam, 2 are located in the hydroelectric reach, 3 are located in the middle basin downstream from Iron Gate Dam, and 2 are located in the lower basin downstream from the Scott River. Although samples are routinely collected in fall, winter, spring, and summer, they are also scheduled to occur prior to and after flooding or pulse flow events (when possible). Samples are processed to determine density, simple demographics, and the prevalence of myxozoan infections including C. shasta and P. minibicornis.
2024 Update: Annelids were sampled in March, May, June (intensive work in mid basin with USFWS) and July in 2024. The fall sampling is planned for early November 2024. In 2024, annelids were most abundant at upper and middle basin sites in March, which contrasts with other years- when annelids are most abundant in warmer months from late spring to fall. Although the mechanism has not yet been determined, we hypothesize that sediment associated with dam deconstruction activity and fire disrupted annelid populations leading to the lower abundance in warmer months. Density and infection assays are in progress.
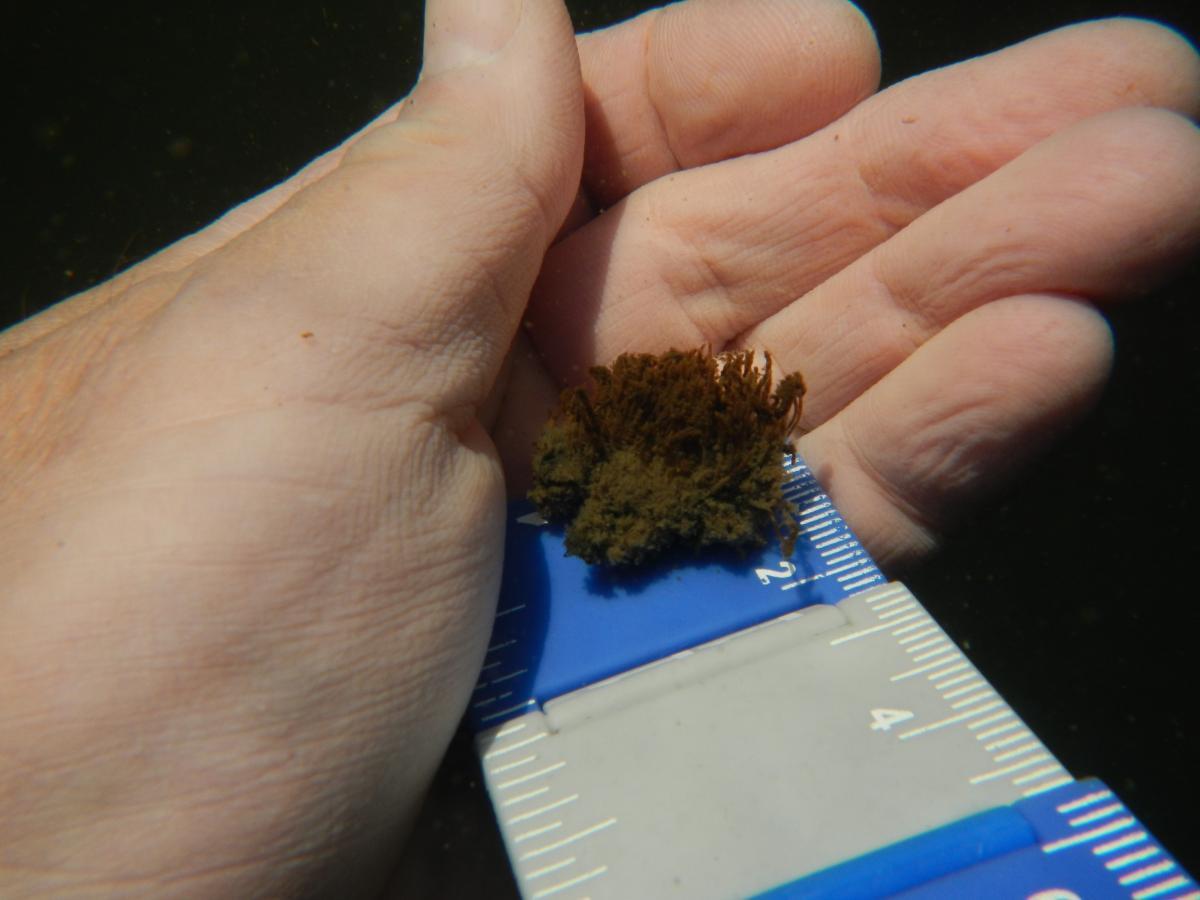
Manayunkia occidentalis tubes from the image on right
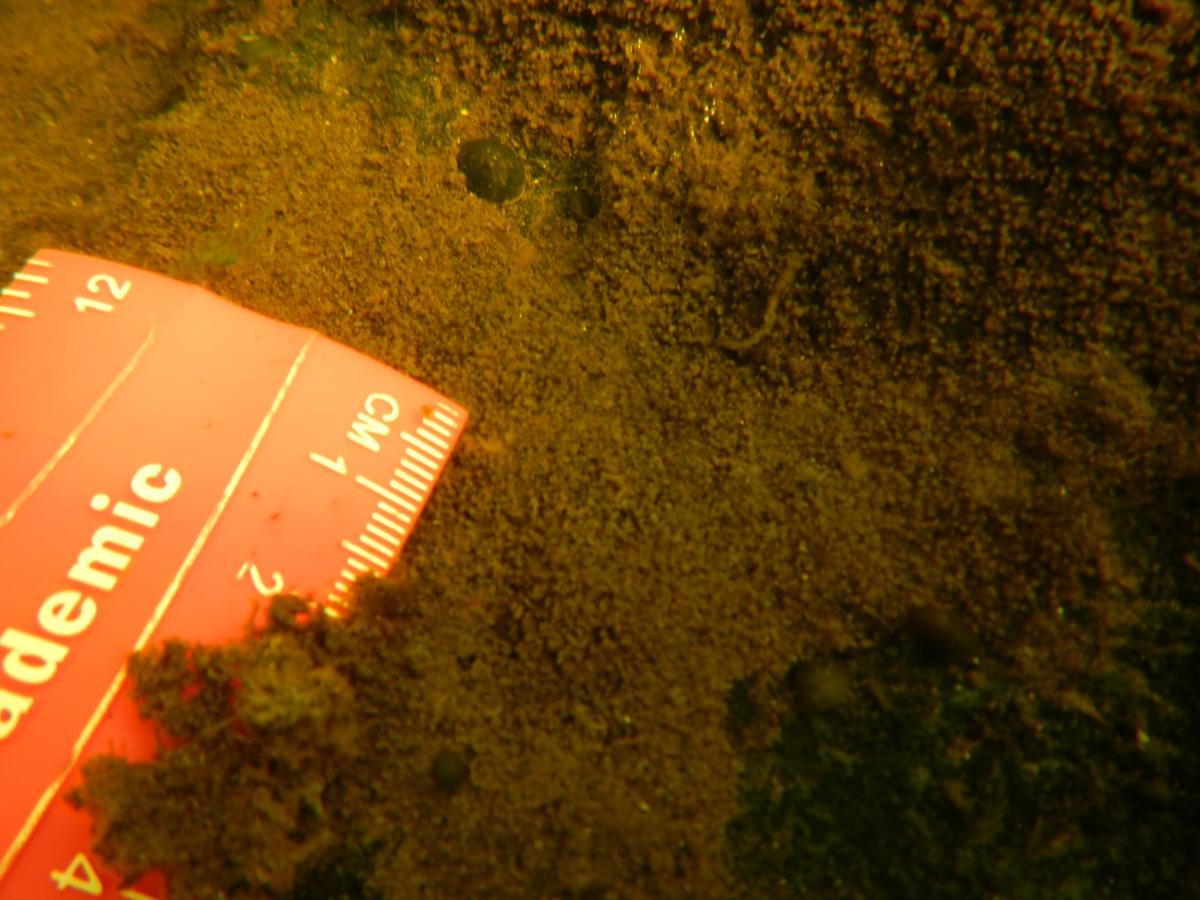
A high density assemblage sample at TOH
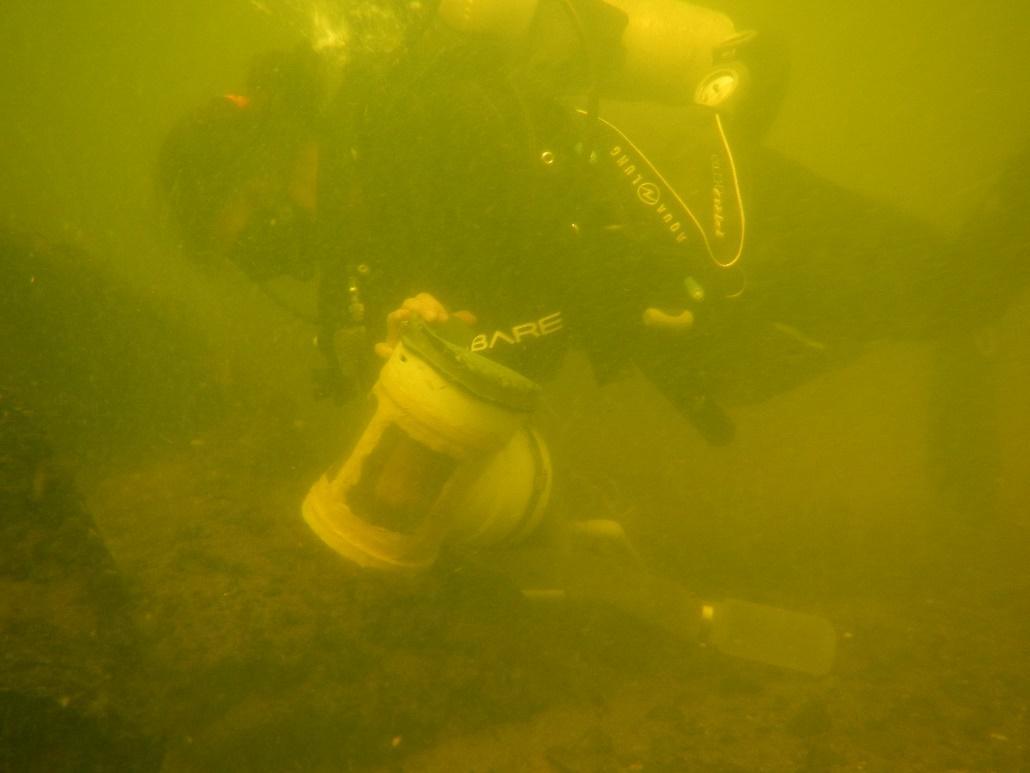
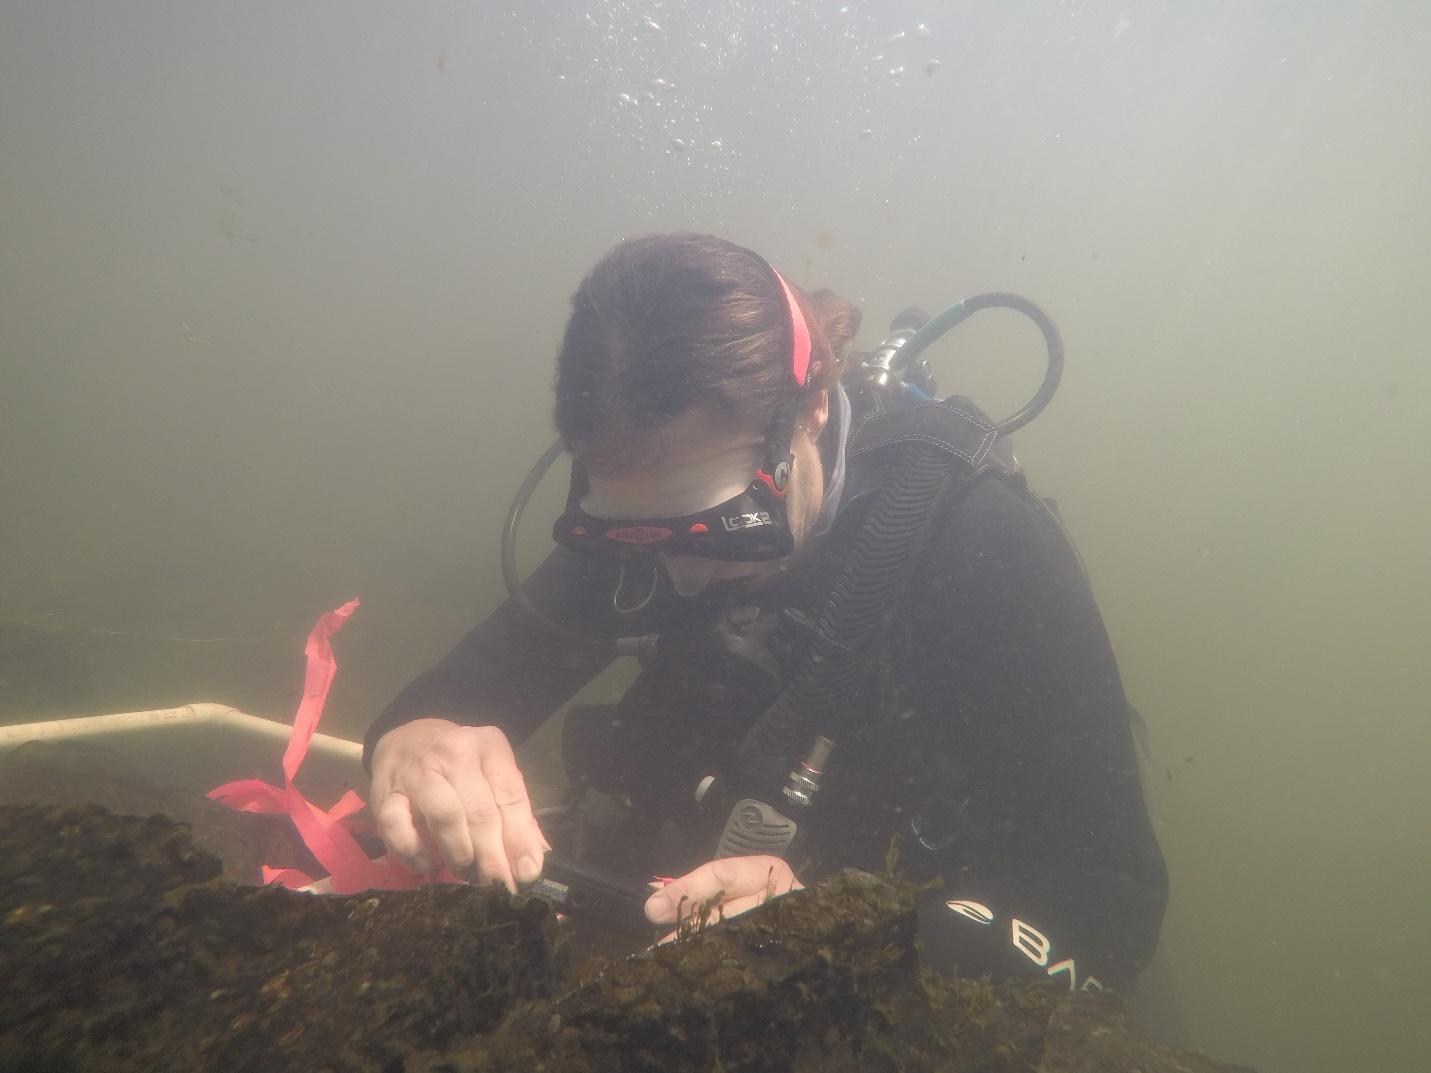
Diver collecting a benthic sample from boulder substrate at the TOH reach. We use a modified Hess sampler fitted with 80um Nytex mesh netting and a 500mL Nalgene collection bottle. Samples are preserved in ethanol until processing.
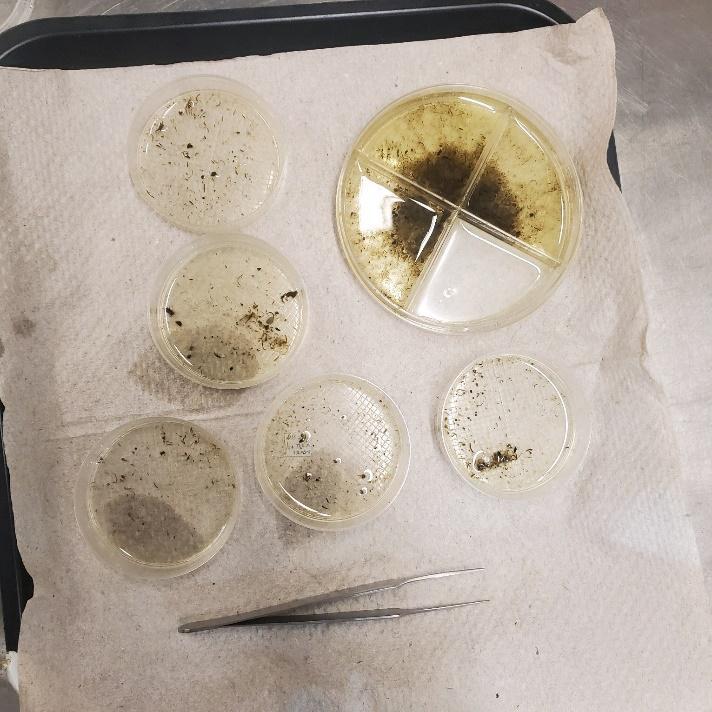
Benthic samples are fractioned prior to sorting.
Dr. Alexander photographing annelids on riprap substrate at the KBC monitoring site.
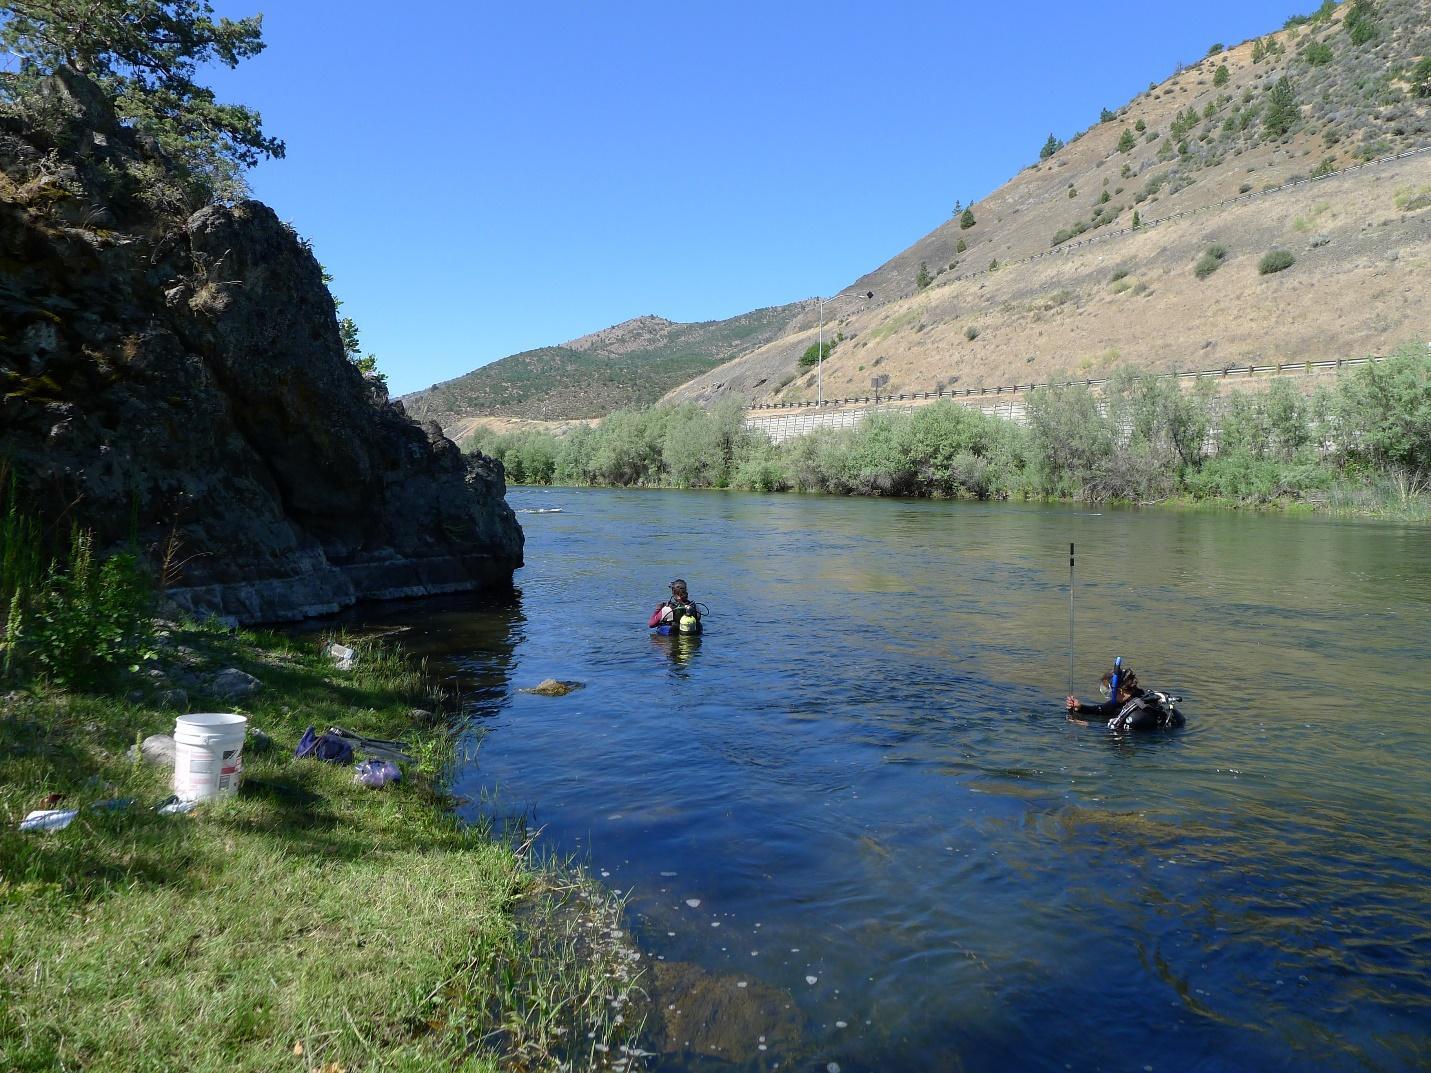
Annelid sampling at the KI5 reach. Foreground diver measures depth and velocity, while background diver measures substrate grain sizes.
Annual reports
Annual reports for Bureau of Reclamation funded studies for 2015 onwards are available. Please contact Sascha Hallett ([email protected]). Annual reports are submitted June 1 the year after the research year.
Annual Klamath River Fish Health Workshop
This year's annual meeting will be held Tuesday April 14th. The meeting will be virtual and registration in advance is required to join:
https://oregonstate.zoom.us/meeting/register/fotxl-8_RhSLMEEXZUIibQ
After registering, you will receive a confirmation email containing information about joining the meeting.
The agenda can be found at this link.
Related Stories
Across the Department


Climate and Oceans
Microbiologist receives $1.2M award to study microbes in a changing ocean

Faculty and Staff